2022 Volume 5 Issue 4
|
INEOS OPEN, 2022, 5 (4), 102–106 Journal of Nesmeyanov Institute of Organoelement Compounds Download PDF |
|
Contact Mass in the Direct Synthesis of Alkoxysilanes. Raman Spectroscopy Study
Nesmeyanov Institute of Organoelement Compounds, Russian Academy of Sciences, ul. Vavilova 28, str. 1, Moscow, 119334 Russia
Corresponding author: R. R. Aysin, e-mail: aysin@ineos.ac.ru
Received 6 March 2023; accepted 13 April 2023
Abstract
Raman spectroscopy was used to study the composition of contact masses (CMs) CuCl + Si obtained by different methods, which are utilized in the direct synthesis of alkoxysilanes. The CMs prepared by the classical method were shown to include copper oxides in a mixture with silicon and on the surface of metallic copper and Cu5Si intermetallide. Along with copper oxides, an active phase containing terminal Cu–Cl groups was also observed. In the case of mechanochemical synthesis, the formation of copper oxides was not observed. In view of the metallic conductivity of Cu3Si and Cu5Si, their direct identification using Raman spectra is not possible. All the mentioned copper-containing phases are involved in the reaction with alcohols and esters as catalysts. A difference between the two methods for obtaining CMs comes down to the presence or absence of a "catalytic cocktail", which significantly affects the parameters of the direct synthesis course.
Key words: direct synthesis of silicones, contact mass, copper chloride, silicon, Raman scattering.
Introduction
Nowadays, there is a revival of interest in the direct synthesis of alkoxysilanes and alkyl alkoxysilanes by the interaction of silicon with alcohols, esters, or alkenes [1–15]. Despite the significant progress in the implementation of the classical chloride synthesis through the Rochow reaction (see review [16]), the rising environmental concerns lead to tightening of the requirements for reducing harmful emissions. In this respect, the direct synthesis of alkoxysilanes offers a more environmentally benign route to the production of silicones [17], which is in good agreement with the main principles of green chemistry [18].
Due to the high inertness of Si and organic reagents, the direct synthesis requires the addition of metal catalysts which are usually based on copper [1–7]. The first step of the synthesis includes the production of the so-called contact mass, in the classic version, a mixture of Si and CuCl heated to 200–350 °C in an inert atmosphere. This results in the formation of metallic copper and CuxSi intermetallides according to the following reactions [19].
7Si + 12CuCl → 3SiCl4 + 4Cu3Si
9Cu5Si + 8CuCl → 2SiCl4+ 7Cu5Si
Cu5Si + 4CuCl → SiCl4+ Cu
It is copper silicides, in particular, Cu3Si that are believed to comprise an active catalytic phase which interacts with alcohols or esters [9–15]. Furthermore, the reaction is assumed to proceed through the formation of reactive silylenes on the surface [20, 21].
The phase composition of the contact mass was commonly analyzed by powder X-ray diffraction (XRD), and the results obtained in all the cited works confirm the formation of Cu3Si or Cu5Si intermetallide. The goal of this work was to create the basis for controlling the process of the direct synthesis at different stages using Raman microspectroscopy. Unlike other methods, the Raman spectra can be registered in situ and offer the advantage of spatial resolution.
Experimental section
The work was concerned with the following commercial reagents: CuO (99%, ABCR AB180315), Cu2O (99%, ABCR AB209068), CuCl (97%, Sigma-Aldrich 212946), Cu5Si (Alfa Aesar 12844), metallic copper particles 3 μm in size (Alfa Aesar 00622), and technical silicon (KR-1, purity >98%, impurities: Fe < 0.7%, Al < 0.7, Ca < 0.6%).
All the conditions and methods for preparing the CMs are presented in Table 1. To prepare the contact mass by the classical method (CM1), a mixture of technical silicon (Si content 98%, particle sizes ~ 60–100 μm) and CuCl in the mass ratio of 5:1 was heated to 350 °C for 30 min in an argon atmosphere. The composition and heating conditions were optimized to achieve the highest activity [14]. According to the elemental analysis data, sample CM1 contained ~80 wt % of Si and 16 wt % of Cu. The second type of contact masses (CM2) containing 7.8 wt % of Cu and 92.2 wt % of Si was obtained by grinding Si and CuCl in a vibration ball mill at 250 °C for 2 h using steel balls [13, 15, 22]. Contact mass CM3 containing 5.8 wt % of Cu and 91.2 wt % of Si was obtained by grinding Si and CuCl in a vibration ball mill at 250 °C for 3 h using brass balls. For the experiment purity, sample CM4 was prepared by vacuum deposition of purified CuCl on a silicon wafer (Si 99.999%) for microelectronics treated with HF followed by heating to 350 °C for 30 min in an inert atmosphere. In addition, the precursors of contact masses CM1 and CM4 not subjected to heating (samples CM1a and CM4a) were studied.
Table 1. Methods and conditions for the synthesis of the CMs
|
CM
|
Si
|
Method for synthesis
|
T, °C
|
Time, min
|
|
CM1
|
Technical activated, 60–100 μm fraction
|
Agitation of the powders in an argon atmosphere
|
350
|
30
|
|
CM2
|
Technical, 1.0–1.5 mm fraction
|
Grinding in a vibration mill with steel balls
|
250
|
120
|
|
CM3
|
Technical, 1.0–1.5 mm fraction
|
Grinding in a vibration mill with brass balls
|
250
|
180
|
|
CM4
|
Single crystalline for microelectro-nics, wafer
|
Surface activation with HF and vacuum deposition of purified CuCl
|
350
|
30
|
The presence of Cu3Si intermetallide in CM1, CM2, and CM3 was confirmed by the results of X-ray diffraction analysis. The X-ray diffraction patterns in the range of 20–100° (2θ) were obtained using a Proto AXRD θ-2θ diffractometer equipped with an X-ray Cu tube with a kβ filter (λ = 1.541874 Å) and a Detris Mythen 1K 1D detector.
The Raman spectra were recorded using a Horiba JobinYovin LabRam 300 Raman spectrometer equipped with a CCD detector and an Olympus BX2 microscope (objectives M-Plan 10x, 50x and 100x). The spectra were excited with a 632.8 nm He–Ne laser with a power of no more than 1 mW. During the investigation, ~600 spectra were recorded.
Results and discussion
Technical silicon (KR-1, purity >98%, impurities: Fe < 0.7%, Al < 0.7, Ca < 0.6%) and metallic silicon for microelectronics (99.999%) were used as the initial components. Their Raman spectra show an intense TO line with a frequency of 520 cm–1, which is slightly broadened in the case of technical Si (Fig. S1 in the Electronic supplementary information (ESI)) due to slight disordering of the crystal lattice.
Commercial copper(I) chloride (purity degree 97%), which is commonly used for the production of contact masses, contains an admixture of Cu4(OH)6Cl2 [16]; therefore, its Raman spectrum shows additional low-intensity lines (Fig. 1a) that correspond to the impurity spectrum [23]. The sublimation in a vacuum of 10–2 Torr at 240–250 °C affords pure CuCl, which Raman spectrum displays lines at 120, 159, and 197 cm–1 on a broad shoulder of the Rayleigh line (Fig. 1b). The Raman spectra of the samples of commercial, purified, and pure CuCl obtained by the published method [24] coincide on the positions of the main lines (Fig. 1) but differ from the spectrum of crystalline γ-modification CuCl, which features narrow lines at 210, 174 cm–1 and a broad low-intensity band at 156 cm–1 [25]. Taking into account the XRD data (Fig. S2 in the ESI) [13, 14], it can be concluded that commercial CuCl used in the direct synthesis exists in the form of an α-modification.
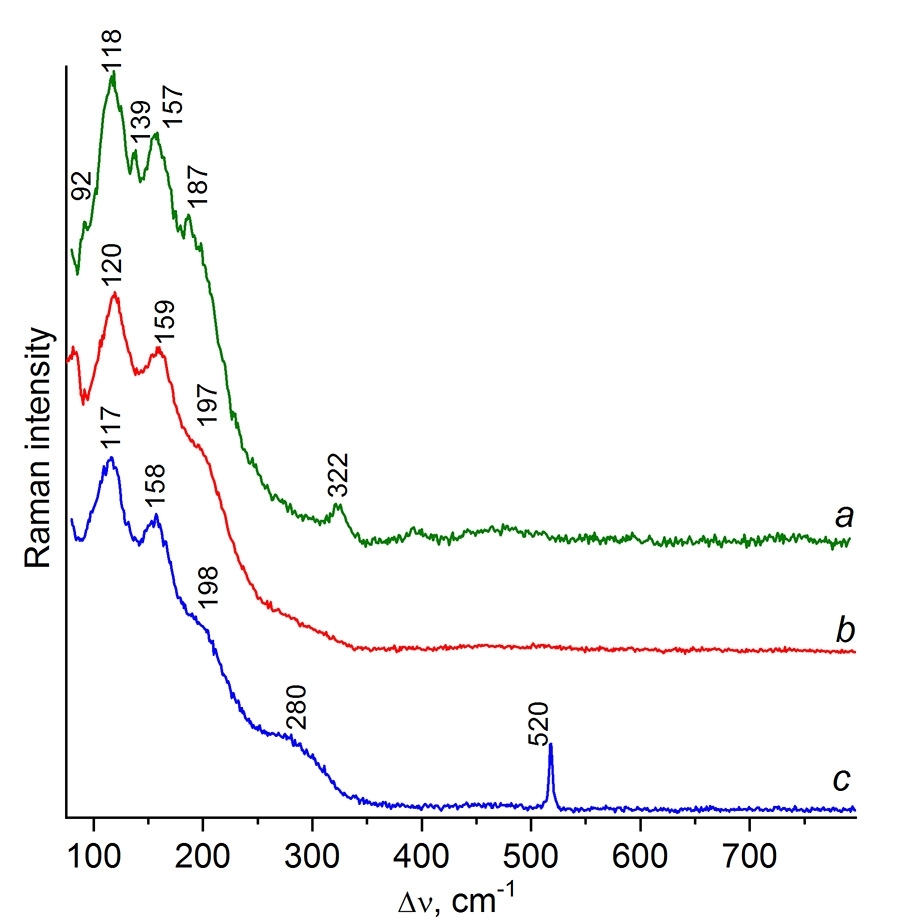
Figure 1. Raman spectra of commercial CuCl (a), purified CuCl (b), and a CuCl film deposited on the Si wafer (c).
In sample CM4a, the presence of a CuCl layer on the Si wafer is confirmed by the CuCl lines (Fig. 1c) and the appearance of the silicon TO mode at 520 cm–1. According to the results of Raman micromapping, sample CM1a which was not subjected to heating, unlike CM4a, as expected, is heterogeneous. In particular, it contains the regions with a pure silicon phase (dark shiny particles) and a mixture of CuCl + Si (light particles) (Figs. S3–S5 in the ESI).
The elucidation of heated contact masses CM1 and CM4 showed some similarities. Firstly, the heated samples have a darker brown color compared to CM1a. Secondly, they do not contain the particles with CuCl. Micromapping of CM1 also revealed the presence of pure silicon (Fig. 2a), which was expected in view of its initial excess, and the formation of new phases mixed with silicon and separately, such as metallic copper and phases with the Raman spectrum depicted in Fig. 2d. Mapping of more homogeneous sample CM4 also revealed phase separation. In one of the regions, along with the visual presence of metallic copper, four different types of spectra were recorded (Fig. 3). Therewith, the Raman spectra of CM1 and CM4 particles presented in Figs. 2d and 3a, 2e and 3d coincide in pairs.
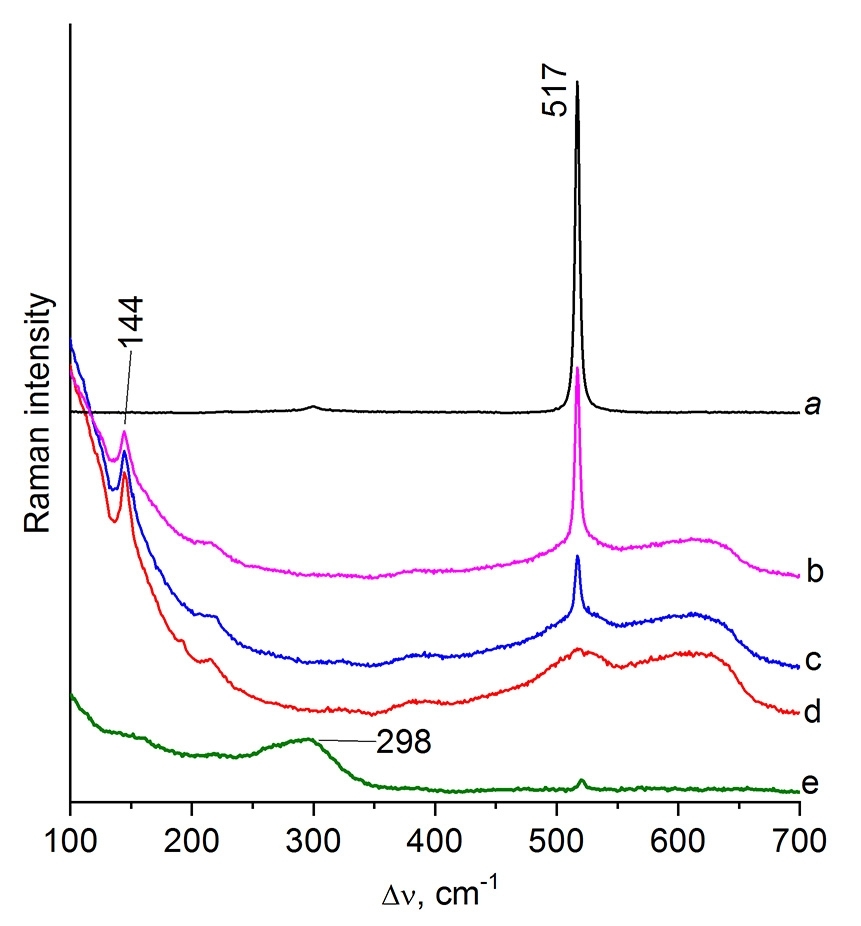
Figure 2. Raman micromapping of CM1.
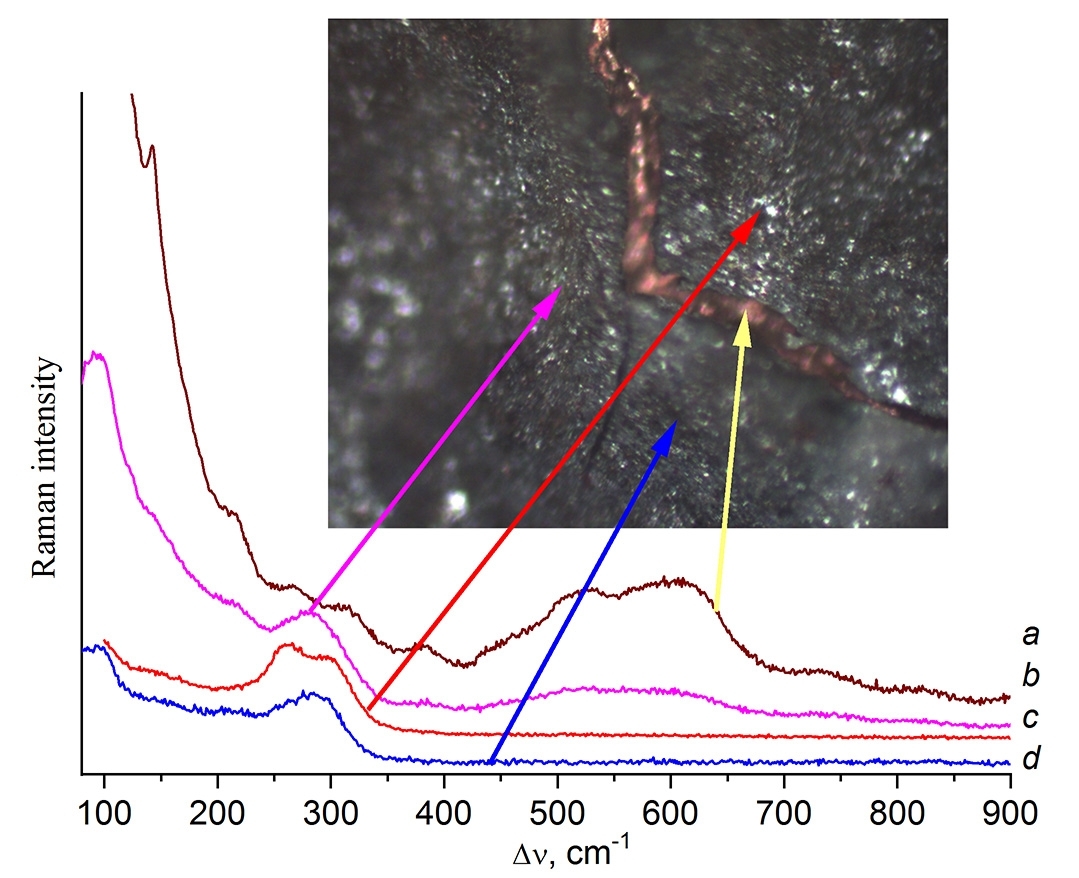
Figure 3. Raman micromapping of CM4.
For the precise assignment of the spectra of the new phases, the spectra of commercial samples of finely dispersed (3 µm) copper, Cu2O, CuO, and Cu5Si were recorded (Fig. 4). The Raman spectra of Cu2O (Fig. 4a) and CuO (Fig. 4b) coincide with the spectra described elsewhere [26] and contain the most intense narrow lines at 220 and 295 cm–1 along with a broad overtone at ~630 cm–1. Metallic copper does not have a vibrational spectrum; however, an oxide film is present on its surface, which was detected in the Raman spectra. Their analysis revealed two types of spectra (Fig. 4c,d) which differ by the presence of a narrow line at 296 cm–1 corresponding to CuO. A broad shoulder of the Rayleigh line, a narrow line at 146 and the broad one at ~690 cm–1 (Fig. 4c) are in good agreement with the Raman spectrum of the second modification of Cu2O [27].
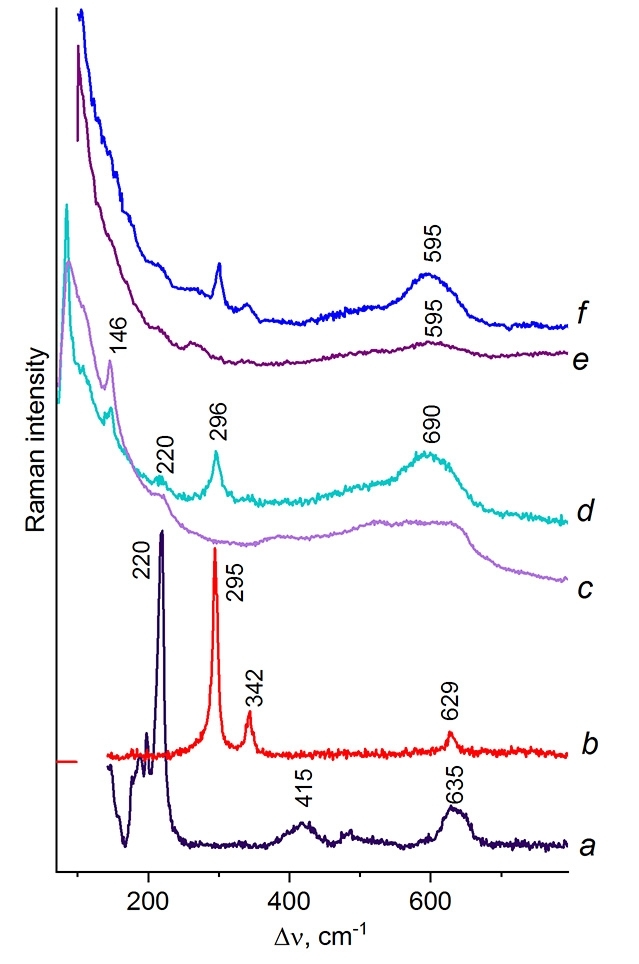
Figure 4. Raman spectra of Cu2O (a), CuO (b), and the oxides on the surface of metallic copper (c, d) compared to
the spectrum of the oxide film on the surface of commercial intermetallide Cu5Si (e, f).
When studying the surface of commercial intermetallide Cu5Si, two types of the spectra were detected (Fig. 4f,e) that differ by the presence and absence of CuO lines at 295 and 342 cm–1. The most characteristic band for Cu5Si is considered to be a broad band at 595 cm–1, which differs in the shape and lower frequency from the similar bands of copper oxides. Since intermetallic compound Cu5Si displays metallic conductivity, it does not have its own vibrational spectrum; therefore, the spectrum in Fig. 4f corresponds to the oxide film and can characterize it only indirectly.
The Raman spectra in Figs. 2e and 3d, recorded for CM1 and CM4 particles, exhibit a broad band at ~290 cm–1 and lack the bands of copper oxides at 144, 220, 298, 343, and 600–630 cm–1. They can be assigned to an intermediate phase containing terminal Cu–Cl groups. The presence of surface Cu–Cl particles that prevent the diffusion of copper into silicon has been reported earlier [2].
It should be noted that Su et al. [28] mistakenly assigned the silicon TO line shifted to 513 cm–1 due to the high power of the exciting laser [29] to Cu3Si phase. Sreedharan et al. [30] presented similar incorrect assignment.
The analysis of the morphology of CM2 and CM3 showed that the particles are aggregated, and their sizes do not exceed 5 µm (Fig. S6 in the ESI). CM2 and CM3 particles under consideration afforded the Raman spectra (several tens of the Raman spectra were recorded) similar to those depicted in Fig. 2a and correspond to crystalline silicon. Moreover, CM2 and CM3 did not contain the particles with the spectra similar to those presented in Figs. 2d,e and 3. Since according to the XRD data (Figs. S7–S9 in the ESI), these contact masses contain Cu3Si phase, it can be assumed that, due to metallic conductivity, intermetallic compound Cu3Si [31] cannot be identified using vibrational spectra. Apparently, Cu3Si does not form a detectable oxide film, unlike Cu5Si.
When analyzing the spectra, it was noted that the Raman spectra of the components such as CuCl, thin surface oxide films on Cu, and Cu5Si are very low intensive, and their registration is a laborious and time-consuming process. These peculiarities should be taken into account when monitoring in situ the direct synthesis using Raman spectroscopy.
In general, Raman spectroscopy studies of the contact masses showed that samples CM1 and CM4 have similar phase compositions and contain crystalline silicon, metallic copper, its oxides of three types, and an intermediate phase with terminal Cu–Cl bonds. The presence of Cu4(OH)6Cl2 impurity in commercial CuCl, which provides a slight increase in the content of copper oxides in the contact mass, is not of fundamental importance. In contrast to samples CM1 and CM4, no copper oxides were found in samples CM2 and CM3. This is likely to be due to the fact that, under conditions of mechanical activation, all copper oxides are converted to Cu3Si. In all the samples explored, the presence of Cu3Si or Cu5Si cannot be directly confirmed by Raman spectroscopy due to their metallic conductivity.
The significantly more diverse phase compositions of contact masses CM1 and CM4, in which different phases have different catalytic activity, are in good agreement with the concept of a "catalytic cocktail" [32]. Mechanochemically prepared CM2 and CM3 do not contain a variety of catalysts like CM1 and CM4, which explains the differences in their reactivity in the synthesis of alkoxysilanes [13–15, 22].
Conclusions
The performed Raman microspectroscopy investigation of contact masses CM1 and CM4, obtained by the classical method used in the direct synthesis of silanes, showed the presence of copper oxides of various modifications both on the surface of metallic copper and in a mixture with crystalline silicon, as well as the formation of the phase containing active terminal Cu–Cl groups. The contact masses prepared mechanochemically did not contain oxides. Due to metallic conductivity of intermetallic compounds Cu3Si and Cu5Si, their presence in the contact masses cannot be directly confirmed using Raman spectroscopy. However, for Cu5Si the Raman spectrum of the oxide film from its surface was presented that differs from the typical Raman spectra of copper oxides Cu2O and CuO, which can indirectly indicate the presence of Cu5Si.
The results of Raman spectroscopy analysis of the copper-containing phases can be useful for their in situ identification during monitoring of the direct synthesis of alkoxysilanes and similar processes.
Electronic supplementary information
Microphotographs, Raman spectra, and powder X-ray diffraction patterns for the samples explored. For ESI, see DOI: 10.32931/io2218a.
Acknowledgements
This work was supported by the Russian Science Foundation (project no. 22-13-00279). The Raman spectra were registered using the equipment of the Center for Molecular Composition Studies of INEOS RAS with financial support from the Ministry of Science and Higher Education of the Russian Federation (agreement no. 075-03-2023-642).
References
- M. Okamoto, Res. Chem. Intermed., 2006, 32, 317–330. DOI: 10.1163/156856706777346462
- N. Yu. Adonin, S. A. Prikhod'ko, A. Yu. Shabalin, I. P. Prosvirin, V. I. Zaikovskii, D. I. Kochubey, D. A. Zyuzin, V. N. Parmon, E. A. Monin, I. A. Bykova, P. O. Martynov, S. L. Rusakov, P. A. Storozhenko, J. Catal., 2016, 338, 143–153. DOI: 10.1016/j.jcat.2016.03.012
- F. Chigondo, B. Zeelie, P. Watts, ACS Sustainable Chem. Eng., 2016, 4, 6237–6243. DOI: 10.1021/acssuschemeng.6b02226
- S. H. Kareem, F. A. ALSaady, N. A. Hikmat, J. Assoc. Arab Univ. Basic Appl. Sci., 2012, 12, 27–32. DOI: 10.1016/j.jaubas.2012.02.004
- G. J. Wang, F. X. Zhang, G. Y. Liu, X. N. Liu, Adv. Mater. Res., 2012, 455–456, 80–86. DOI: 10.4028/www.scientific.net/AMR.455-456.80
- Z. Lei, H. Sue, Y. Chunhui, L. Ji, Y. Kai, H. Chenfa, G. Shibin, Appl. Organomet. Chem., 2011, 25, 508–513. DOI: 10.1002/aoc.1794
- J.-S. Han, J.-H. Cho, M.-E. Lee, B.-R. Yoo, Bull. Korean Chem. Soc., 2009, 30, 683–686. DOI: 10.5012/bkcs.2009.30.3.683
- M. N. Temnikov, A. S. Zhiltsov, V. M. Kotov, I. V. Krylova, M. P. Egorov, A. M. Muzafarov, Silicon, 2015, 7, 69–78. DOI: 10.1007/s12633-014-9236-9
- A. A. Kalinina, I. V. Elmanovich, M. N. Temnikov, M. A. Pigaleva, A. S. Zhiltsov, M. O. Gallyamov, A. M. Muzafarov, RSC Adv., 2015, 5, 5664–5666. DOI: 10.1039/C4RA13619E
- D.-H. Sun, B. E. Bent, A. P. Wright, B. M. Naasz, Catal. Lett., 1997, 46, 127–132. DOI: 10.1023/A:1019025325414
- M. P. Clarke, J. Organomet. Chem., 1989, 376, 165–222. DOI: 10.1016/0022-328X(89)85131-9
- L. Zhang, J. Li, K. Yang, C. F. Hu, S. B. Ge, C. H. Yang, Adv. Mater. Res., 2011, 233–235, 1534–1539. DOI: 10.4028/www.scientific.net/AMR.233-235.1534
- I. N. Krizhanovskiy, M. N. Temnikov, A. A. Anisimov, A. K. Ratnikov, I. S. Levin, A. V. Naumkin, S. M. Chistovalova, A. M. Muzafarov, React. Chem. Eng., 2022, 7, 769–780. DOI: 10.1039/D1RE00522G
- M. N. Temnikov, A. A. Anisimov, P. V. Zhemchugov, D. N. Kholodkov, A. S. Goloveshkin, A. V. Naumkin, S. M. Chistovalov, D. Katsoulis, A. M. Muzafarov, Green Chem., 2018, 20, 1962–1969. DOI: 10.1039/C7GC03862C
- M. N. Temnikov, A. A. Anisimov, S. M. Chistovalov, P. V. Zhemchugov, D. N. Kholodkov, S. N. Zimovets, Yu. S. Vysochinskaya, A. M. Muzafarov, Russ. Chem. Bull., 2019, 68, 270–274. DOI: 10.1007/s11172-019-2382-x
- Y. Zhang, J. Li, H. Liu, Y. Ji, Z. Zhong, F. Su, ChemCatChem, 2019, 2757–2779. DOI: 10.1002/cctc.201900385
- G. A. Abakumov, A. V. Piskunov, V. K. Cherkasov, I. L. Fedushkin, V. P. Ananikov, D. B. Eremin, E. G. Gordeev, I. P. Beletskaya, A. D. Averin, M. N. Bochkarev, A. A. Trifonov, U. M. Dzhemilev, V. A. D'yakonov, M. P. Egorov, A. N. Vereshchagin, M. A. Syroeshkin, V. V. Jouikov, A. M. Muzafarov, A. A. Anisimov, A. V. Arzumanyan, Yu. N. Kononevich, M. N. Temnikov, O. G. Sinyashin, Yu. H. Budnikova, A. R. Burilov, A. A. Karasik, V. F. Mironov, P. A. Storozhenko, G. I. Shcherbakova, B. A. Trofimov, S. V. Amosova, N. K. Gusarova, V. A. Potapov, V. B. Shur, V. V. Burlakov, V. S. Bogdanov, M. V. Andreev, Russ. Chem. Rev., 2018, 87, 393–507. DOI: 10.1070/RCR4795
- P. T. Anastas, J. C. Warner, Green Chemistry: Theory and Practice, Oxford Univ. Press, New York, 1998.
- B. Gillot, G. Weber, H. Souha, M. Zenkouar, J. Alloys Compd., 1998, 270, 275–280. DOI: 10.1016/S0925-8388(98)00527-1
- M. Okamoto, S. Onodera, T. Okano, E. Suzuki, Y. Ono, J. Organomet. Chem., 1997, 531, 67–71. DOI: 10.1016/S0022-328X(96)06713-7
- M. P. Clarke, I. M. T. Davidson, J. Organomet. Chem., 1991, 408, 149–156. DOI: 10.1016/0022-328X(91)86378-4
- S. M. Chistovalov, V. M. Kotov, A. A. Anisimov, M. N. Temnikov, P. V. Zhemchugov, A. M. Muzafarov, Chem. Pet. Eng., 2019, 54, 703–707. DOI: 10.1007/s10556-019-00536-6
- X.-D. Liu, X.-G. Zheng, D.-D. Meng, X.-L. Xu, Q.-X. Guo, J. Phys.: Condens. Matter, 2013, 25, 256003. DOI: 10.1088/0953-8984/25/25/256003
- V. A. Karyakin, I. N. Angelov, Pure Chemical Compounds, Khimiya, Moscow, 1974 (in Russian).
- A. Göbel, T. Ruf, C.-T. Lin, M. Cardona, J.-C. Merle, M. Joucla, Phys. Rev. B, 1997, 56, 210–220. DOI: 10.1103/PhysRevB.56.210
- J. Kaur, A. Khanna, R. Kumar, R. Chandra, J. Mater. Sci.: Mater. Electron., 2022, 33, 16154–16166. DOI: 10.1007/s10854-022-08506-0
- A. S. Zoolfakar, R. A. Rani, A. J. Morfa, A. P. O'Mullaned, K. Kalantar-zadeh, J. Mater. Chem. C, 2014, 2, 5247–5270. DOI: 10.1039/c4tc00345d
- K. Su, J. Luo, Y. Ji, X. Jiang, J. Li, J. Zhang, Z. Zhong, F. Su, J. Solid State Chem., 2021, 304, 122591. DOI: 10.1016/j.jssc.2021.122591
- S. S. Bukalov, R. R. Aysin, Mendeleev Comm., 2023, 33, 209–211. DOI: 10.1016/j.mencom.2023.02.019
- R. Sreedharan, M. Mohan, S. Saini, A. Roy, K. Bhattacharjee, ACS Omega, 2021, 6, 23826–23836. DOI: 10.1021/acsomega.1c02646
- P. Chen, Y. Li, F. Qin, T. An, Y. Dai, M. Zhang, M. Liu, L. Zhang, Surf. Interfaces, 2022, 31, 102084. DOI: 10.1016/j.surfin.2022.102084
- V. P. Ananikov, I. P. Beletskaya, Organometallics, 2012, 31, 1595–1604. DOI: 10.1021/om201120n


