


ASAP
|
|
INEOS OPEN, 2024, 7 (X), XX–XX Journal of Nesmeyanov Institute of Organoelement Compounds |
|

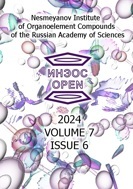
Orange Room-Temperature Phosphorescence in Complexes of Pyrene-d10–β-Cyclodextrin with Bulk Molecules in the Presence of Oxygen
a NRC "Kurchatov Institute", Photochemical Department, ul. Novatorov 7a/1, Moscow, 119421 Russia
b Federal Research Center of Problems of Chemical Physics and Medicinal Chemistry, Russian Academy of Sciences, ul. Akademika Semenova 1, Chernogolovka, Moscow Oblast, 142432 Russia
Corresponding author: V. G. Avakyan, e-mail: avak@photonics.ru
Received 28 June 2024; accepted 2 September 2024
Abstract
The long-lived room temperature phosphorescence (RTP) and fluorescence of a pyrene-d10–β-cyclodextrin (Pd10–CD) complex were studied before and after the removal of O2 as well as after the addition of bulk molecules (BM), namely, tert-butylbenzene, p-tert-butyltoluene, and adamantane. The biexponential decay of the RTP intensity of the complexes indicates the presence of two types of phosphorescent sites (PSs) in the crystal lattice of 2BM-2CD. The emission and quenching rate constants of Pd10 RTP in all the complexes and the PS structures were calculated by quantum chemistry methods. The assignments and selection rules of vibrational fine structure lines in the emission spectra are discussed.
Key words: room-temperature phosphorescence, pyrene-d10–β-cyclodextrin complex, bulk molecules, phosphorescence emission and quenching constants.
Introduction
The materials with long afterglow, mainly phosphorescence, are widely used in bioimaging [1–3], data encryption [4, 5], and optoelectronic devices [6, 7], which makes the search for new systems with such properties an urgent task. At the same time, room-temperature phosphorescence (RTP) of purely organic materials attracts increasing attention due to the low cost of components, good biocompatibility and high signal-to-noise ratio. Long-lived RTP of polyaromatic hydrocarbons (arenes, A), as the most available luminophores, is observed when A is placed into a rigid environment and isolated from oxygen. In particular, RTP is observed upon formation of the aggregated structures of A [8], in polyacrylamide films [9], in supramolecular inclusion complexes of A in cyclodextrins (CDs), where bulk molecules (BM) of another hydrocarbon are added for denser packing of A [10, 11]. Among the available arenes, of particular interest in terms of searching for systems with RTP in supramolecular complexes with CDS is pyrene (P), which remains largely unexplored. This may be due to the fact that P is prone to form excimers (excited dimers PP*) in solutions even at low concentrations, which prevents the appearance of RTP. The excimers are readily formed in PP*@γCD complexes since two P molecules fit into the γCD cavities [12a]. Hereinafter, the symbol @ is used to designate CD inclusion complexes with defined stoichiometry, while symbol – is used to designate the composition of the complexes. In the inclusion complex of P in β-cyclodextrin, which according to the experiments [12] and calculations [13b] has a 1:2 stoichiometry, P@2CD, the formation of excimers is excluded, since two P molecules do not fit into the cavity of the CD dimer. This opens up the possibility of studying luminescence of an isolated P molecule in inclusion complexes in CD.
Earlier the compounds with heavy atoms were almost always used to study RTP of P [14–16]. The heavy atom-induced quenching became a means of detecting polycyclic aromatic compounds in an aqueous medium, including those containing P and carcinogenic benzopyrene [17]. At the same time, the heavy atom in these systems, along with an increase in the S1–T1 conversion rate (a positive factor), also leads to a significant increase in the rate of the T1–S0 radiative transition (a negative factor for long-lived RTP). For example, Raj et al. [16] found that the lifetime of the P-induced quenching was only 326 ns. Nevertheless, it should be noted that an increase in the rate of the T1–S0 transition considerably reduces the effect of oxygen on RTP quenching, which facilitates its registration.
Therefore, when creating supramolecular systems based on deuterated A [18] and CD characterized by long-lived RTP in the presence of O2, we excluded the use of a heavy atom and were guided by the principle of maximum filling of the cavity volume (MFCV) in P@2CD upon addition of BM [11]. Earlier it was shown that the addition of adamantane (Ad) (maximum τph = 15 s [11]), tert-butylbenzene (tBB), or p-tert-butyltoluene (tBT) as BM [19] to a naphthalene-d8@2CD complex, as well as the addition of the last two BMs to a phenanthrene@2CD complex [20] indeed allowed for observing long-lived RTP (seconds) of naphthalene-d8 and phenanthrene, respectively, in the presence of oxygen. Therefore, it seemed interesting to study pyrene-d10 complexes Pd10@2CD in the presence of Ad, tBB and tBT in the hope of observing long-lived RTP.
Pyrene is also of particular interest since its fluorescence spectrum features a well-resolved fine vibrational structure, and the ratio of the amplitudes of the third and first vibronic lines I3/I1 is very sensitive to the chemical nature of the molecules surrounding P. This is observed both in solutions of P in different solvents [21] and in its complexes with CD with various analytes added in micromolar concentrations [13]. This property served as a main factor for using the complexes of P with CD as sensors for aromatic amino acids [22]. It could be expected that the fluorescence and RTP spectra of P in a complex with CD would have similar vibrational structures, since in both cases the emission of the molecules of P occurs from the excited S1 and T1 states, respectively, to the same vibrational levels of the ground state S0. However, it is still unclear to what extent these spectra are similar and how the addition of a third component to the P–CD complex affects the vibronic structure of the RTP spectrum.
The goals of this work were as follows: 1) to detect and to study all characteristics of long-lived RTP of Pd10 in Pd10@2CD complexes with tBB, tBT, and Ad added as BMs; 2) to compare the vibronic structure of the RTP and fluorescence spectra in Pd10–CD–BM systems and to study of the effect of the added BM on the vibronic structure of these spectra; (3) to calculate the structure and energy values of the S1–S0 and T1–S0 transitions of Pd10–CD–BM complexes by quantum chemistry methods (DFT and TDDFT methods) in order to detect the relationship between the structure of the complexes and the observed luminescence spectra of Pd10.
2. Results and discussion
The following abbreviations are used in this work: P for pyrene, Pd10 for pyrene-d10, CD for β-cyclodextrin, tBB for tert-butylbenzene, tBT for p-tert-butyltoluene, and Ad for adamantane. The general name of bulky molecules added to Pd10@2CD for observation of RTP in the presence of oxygen is BM. Scheme 1 shows the structures of the following compounds: P (a), tBB (b), CD (c), Ad (d), tBT (e).

Scheme 1. Structures of the compounds used in this work.
2.1. RTP spectra and lifetimes
2.1.1. RTP of crystalline precipitates of Pd10–CD–BM. Figure 1 shows a photograph of the cuvette with a phosphorescent suspension of the three-component complex Pd10–CD–tBT taken immediately after turning off the exciting light. As can be seen, prolonged orange emission (τph = 4.02 s) is concentrated directly in the suspension particles, while after sedimentation the mother liquor is not phosphorescent. The precipitation time significantly exceeds τph of Pd10. Interestingly, the addition of tBB to an aqueous solution of the phenanthrene@CD complex leads to green RTP of phenanthrene with a duration of 2.7 s [20].

Figure 1. Photograph of the cuvette with phosphorescent precipitate of Pd10–CD–tBT.
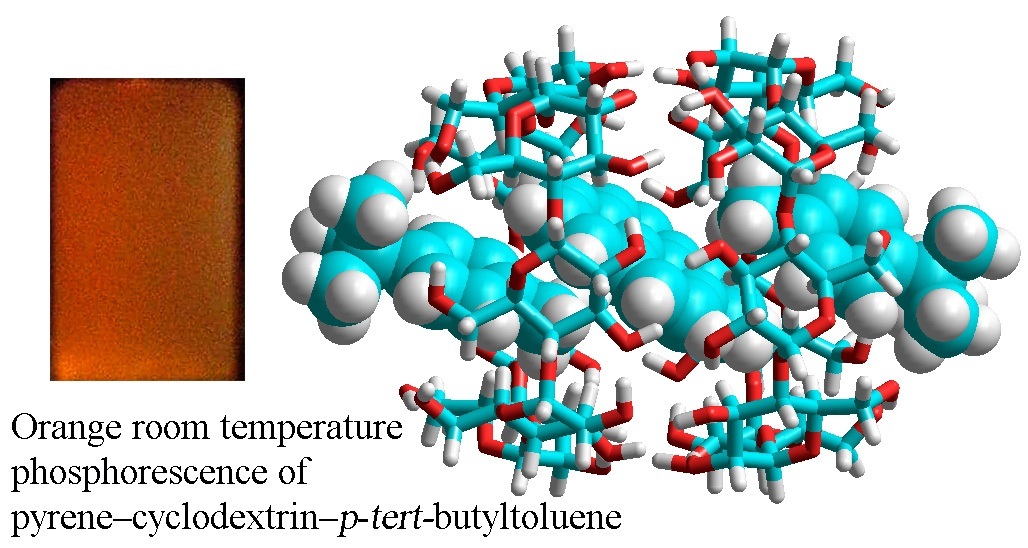
Figure 2 depicts the RTP spectra of the crystalline precipitates of Pd10–CD–BM and, for comparison, the RTP spectrum of the two-component system Pd10–CD (black curve) at the CD concentration of 0.06 M measured after the removal of oxygen.
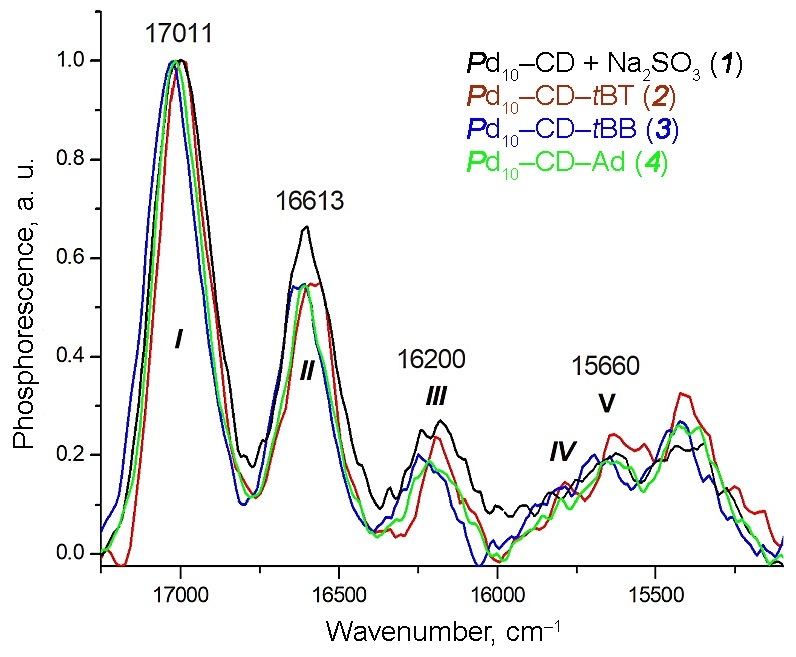
Figure 2. RTP spectra of the crystalline precipitates of Pd10–CD–BM with the frequencies of the most intensive vibronic lines. The vibronic lines are designated according to the numbering scheme used for the fluorescence spectra [21].
All the spectra represent a set of lines of a well-resolved vibronic structure. Moreover, the use of different BMs (tBB, tBT, and Ad) leads to almost identical contours of the RTP spectra for the three-component systems Pd10–CD–tBB, Pd10–CD–tBT, and Pd10–CD–Ad. The presence of BM in the complexes allows for observing the RTP effect both in the presence and in the absence of oxygen. The RTP spectra of Pd10–CD–BM also visually coincide with the RTP spectrum of the two-component system Pd10–CD obtained for the first time. In all spectra, the most intense line appears to be line I, which relates to the purely electronic radiative 0–0 transition T1→S0. The values of the frequencies of vibronic transitions in the individual spectra of each of the systems explored are given in Table 1 and are discussed in detail below.
Table 1. Measured frequencies (cm–1) of the vibronic transitions in the RTP, phosphorescence (P) and fluorescence (F) spectra; the values of Δν (Δν = ν0–0–νi; i = 2–5), widths of line I (Δν½), numeration for the first five lines, and the ratios of the intensities of lines III and I (I3/I1)
|
Sample, F/P
|
Ia (0–0), Dn½
|
II, Dn
|
III, Dn, I3/I1
|
IV, Dn
|
V, Dn
|
|
Pd10@CD, F
|
26841, 300
|
26370, 471
|
26080, 761, 1.47
|
–
|
25503, 1338
|
|
Pd10@CD + Na2SO3, RTP
|
17011, 218
|
16613, 398
|
16200, 811
|
15841, 1170
|
15625, 1386
|
|
Pd10–CD–tBB, F
|
26840, 235
|
26408, 432
|
26100,740, 1.34
|
|
25466, 1374
|
|
Pd10–CD–tBB, RTP
|
17013, 197
|
16607, 416
|
16204, 809
|
15851, 1162
|
15618, 1395
|
|
Pd10–CD–tBT, F
|
26840, 235
|
26406, 434
|
26106,734, 1.43
|
–
|
25466, 1374
|
|
Pd10–CD–tBT, F, 77 K
|
26982, 110
|
26589, 393
|
26256, 726
|
25756, 1266
|
25583, 1399
|
|
Pd10–CD–tBT, RTP
|
17011, 176
|
16613, 398
|
16200, 811
|
15837, 1174
|
15660, 1351
|
|
Pd10–CD–tBT, F, 77 K
|
16995, 100
|
16588, 407
|
16285, 710
|
15845, 1150
|
15668, 1327
|
|
Pd10–CD–Ad, F
|
26845, 230
|
26391, 454
|
26117, 728, 1.27
|
–
|
25479, 1366
|
|
Pd10–CD–Ad, RTP
|
17018, 156
|
16618, 400
|
16226, 792
|
15792, 1226
|
15612, 1406
|
|
bRTP: Dni/ncalc/nexpc
|
|
403±9/396/407
|
732±6/741/735
|
1183±29/1157/1143
|
1383±22/1386/1406
|
|
bF: Dni/ncalc/nexpc |
448±18/457/433 |
807±19/802/805 |
| a the first five lines in the spectra are designated in Roman numbers (according to Ref. [21]); b the average values of Δνi for RTP and F, respectively; c νcalc and νexp are the calculated and experimental [23] values of the vibration frequencies of Pd10. |
2.1.2. Vibronic structure of the luminescence spectra. The compounds added to the phenanthrene@CD complex affected the relative intensities of lines II and III. This allowed us to determine which group, aromatic or hydrocarbon, contacts the phenanthrene plane in the complex cavity [13]. Therefore, we expected that the addition of BM capable of contacting the pyrene molecule through different parts inside the complex, namely, tert-butyl groups, benzene, methylbenzene, or adamantyl units would also allow us to follow these differences in the pyrene fluorescence spectrum.
However, as in the RTP spectra in Fig. 2, the contours of the fluorescence spectra in Fig. 3 are almost independent of the BM used and differ little from the spectrum of Pd10–CD binary system. Therefore, we failed to obtain data on the difference in contacts between BM and Pd10 inside their complexes with CD. The comparison of the contours of the RTP and fluorescence spectra revealed five lines of fine vibronic structure in the range of 17000–15500 for the former and 27000–25000 cm–1 for the latter. However, the ratios of the line intensities in each emission spectra differ significantly, which is explained by the difference in the selection rules for vibrational transitions in phosphorescence and fluorescence. The values of the frequencies of vibronic transitions, measured as the difference between the frequency of line I and the frequencies of the other i lines, Δν = ν0–0–νi (i = 2–5), as well as other spectral parameters for all the systems explored are presented in Table 1. It is important to note that, despite the same contours, the spectrum of each system has an individual set of frequencies. Therefore, to assign the vibronic lines to vibrations of the pyrene molecule, active in both emission spectra, we averaged the values of νi for each of lines II–V and compared them in Table 1 with the values νcalc calculated by the DFT method and the experimental νi values of the Pd10 molecule.
Figure 3. Fluorescence spectra of Pd10–CD (1) and Pd10–CD–BM (2–4) normalized by the intensity of 0–0 transition (0I) with the frequencies of the most intensive vibronic lines.
When passing from the two-component system Pd10@2CD to the three-component complexes, the main difference in the fluorescence spectrum is that for tBB and Ad the ratio I3/I1 (in our notation IIII/II) decreases to 1.34 and 1.27, respectively, and remains almost unchanged for tBT compared to 1.47 for Pd10@2CD). In addition, the maximum value of the width of line I (0–0 transition) Δν½ is observed in the Pd10@2CD complex both in fluorescence and RTP. For the series of tBB, tBT, and Ad added molecules, the value of Δν½ gradually decreases to 197, 176, and 156 cm–1, respectively, compared to 218 cm–1 for Pd10@2CD.
The changes in the line widths can be attributed to the fact that in the Pd10@2CD crystal hydrate, pyrene is arranged in a more polar environment (water, vide infra) than in the presence of hydrocarbon BMs. Therefore, the line width of the 0–0 transition in the Pd10@2CD complex is larger than those in the three-component complexes. The minimum value of Δν½ for Pd10–CD–Ad can be explained by the fact that the RTP spectrum of this system is characterized by a monoexponential decline; therefore, Pd10 inside PS has a uniform environment, since the Ad molecule has a spherical shape.
Thus, different BMs added to the Pd10@2CD complex do not change significantly the structure of the luminescence spectra, and small changes in the parameters of the fluorescence spectra are not enough to judge the changes in the microstructure of this complex on passing to three-component systems. But the addition of BM certainly promotes the appearance of long-lived RTP in the presence of oxygen, and for the Pd10–CD–tBT complex after the removal of oxygen, the value of τph increases to 4.02 s compared to 2.35 s in the case of Pd10@2CD (vide infra).
Lines II and III in the RTP spectra feature shorter wavelengths ΔνII and ΔνIII than those in the fluorescence spectra. This implies that the lines of the vibronic structure relate to different vibration frequencies of Pd10. The assignments will be presented below.
2.1.3. Fluorescence and phosphorescence spectra at 77 K, assignments of the vibronic transition lines. In order to obtain higher resolution spectra for more accurate assignment of the vibronic transition lines to the vibrational modes of Pd10, the fluorescence and phosphorescence spectra were recorded at 77 K (Fig. 4).
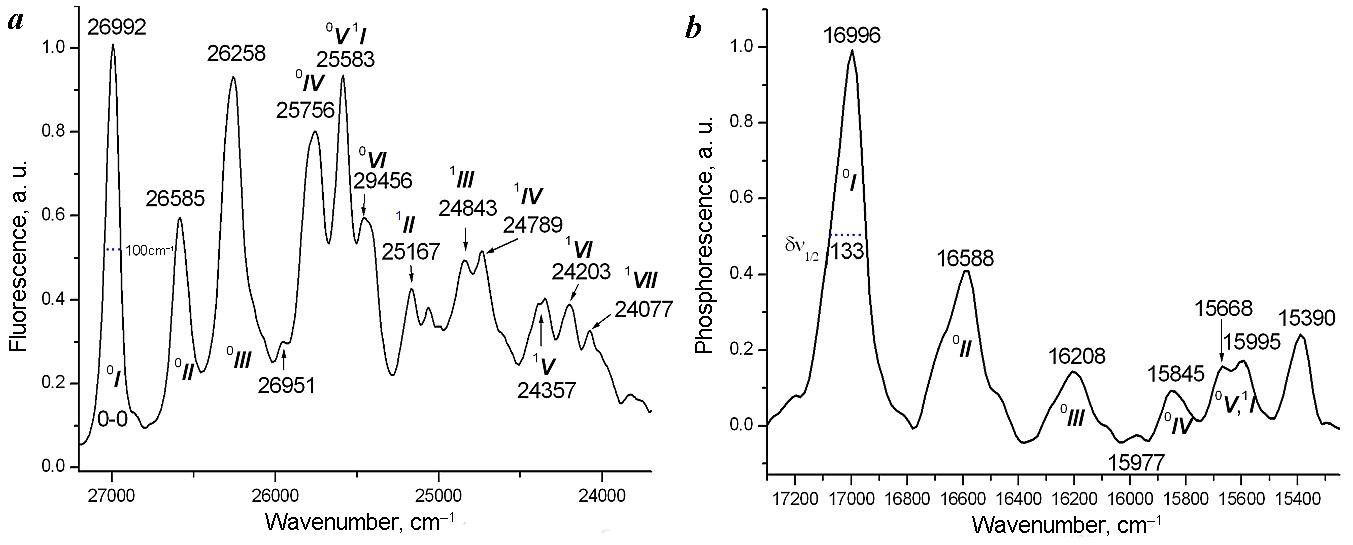
Figure 4. Fluorescence (a) and phosphorescence (b) spectra Pd10–CD–tBT at 77 K. The vibration transition lines are designated with the Roman numbers. The superscripts 0 and 1 indicate the main and overtone vibrational levels of the Pd10 molecule in the ground state. The values of Δν½ for line I are presented on both spectra.
The comparison of the data in Table 1 shows that a decrease in the temperature leads to narrowing of line I (0–0 transition) in the fluorescence spectrum of Pd10–CD–tBT more than two times (Δν½ = 234 and 100 cm–1 at room temperature and 77 K, respectively), while in the phosphorescence spectrum Δν½ changes to a lesser extent (from 201 to 133 cm–1) and the widths of the other lines, including Δν½ of line III, remain virtually unchanged.
Due to the temperature narrowing, it can be seen that the fluorescence spectra of the Pd10 molecule consist of two vibrational progressions corresponding to the transition to the ground (designated with the superscript 0) and the first overtone (designated with the superscript 1) levels with a difference in the progressions of the ground and excited vibrational states of Δν = 1399 cm–1. The line at 25583 cm–1 (Fig. 4) is the beginning of the overtone vibrational progression and, therefore, has two designations 0V and 1I. The difference in the progression is consistent with an analogous value in the absorption spectra of the double complex P@2CD: 1431 cm–1 [13b]. An interesting feature of the low-temperature fluorescence spectrum is that the ratio I3/I1 drastically changes compared to the spectrum at room temperature (0.93 and 1.34, respectively). This indicates that the empirical rule that the value of I3/I1 is a measure of the polarity of the environment of the P molecule in solutions [21] or complexes [13] is valid only for the spectra measured at room temperature.
For the phosphorescence spectrum (Fig. 4b), the lines of the vibrational progression II–V of the ground vibrational state are also reliably determined, although the temperature narrowing of the lines is smaller compared to that observed in the fluorescence spectrum.
The general comparison shows that the values of differences Δνi in both emission spectra are consistent with each other. Visually, it may seem that the same vibrational levels are populated in the radiative transitions S1→S0 and T1→S0, respectively. Thus, in the fluorescence spectra, lines II, III, IV, and V correspond to the fully symmetric Ag-type vibrational transitions ν13, ν11, ν9, and ν6 of the Pd10 molecule [13b]. However, from the average values of Δνi, it is obvious that when going from the fluorescence spectrum to the RTP spectrum for all the Pd10–CD–BM explored, the frequencies of lines II and III differ. This fact calls into question the assignment of lines II and III in the phosphorescence spectra to ν13 and ν11 transitions by analogy with the fluorescence spectra. Since the assignments based on Ref. [23] show that the vibrational fine structure of the emission spectra involves vibrations of even symmetry, in particular, Ag, then the closest even vibration to ν11 and ν13 are ν23 (735 cm–1) and ν25 (457 cm–1) of B3g symmetry. Thus, we assumed that lines II, III, IV, and V in the RTP spectra belong to ν25, ν23, ν9, and ν6 vibrational transitions of the ground S0 state of Pd10, and, consequently, the difference in the selection rules for vibrational transitions in fluorescence and phosphorescence spectra is that lines II and III in the former belong to the Ag-type vibrations, while in the latter they belong to B3g-type vibrations.
Table 2 shows that the vibration frequencies νi of the Pd10 molecule calculated by the DFT/PBE method are in satisfactory agreement with the average values of νi in both emission spectra.
Table 2. Values of Etotal (a.u.) and ν0–0 transitions (cm–1) in the fluorescence and RTP spectra calculated by the DFT/B3LYP/D3 and TDDFT/B3LYP/D3 methods with full geometry optimization for Pd10·2BM@CD complexes
|
Complex, type
|
Etotal S0 (DE)
|
Etotal S1
|
ν0–0 (F)
|
ν0–0 (RTP)
|
|
P×@2CD, I
|
–1226.29655
|
–1226.30369
|
27911
26861a
|
17586
17004a
|
|
P×2tBT@2CD, I
|
–1473.13976
|
–1473.00576
|
26967
26840
|
17194
17011
|
|
P×2tBT@2CD, II
|
–1473.13674 (1.9)b
|
–1473.00213 (2.3)
|
28957
|
18664
|
|
P×2tBB@2CD, I
|
–1394.52193
|
–1394.38973
|
26721
26840
|
16466
17013
|
|
P×2tBB@2CD, II
|
–1394.52899
(–4.4) |
–1394.39379
(–2.5) |
28740
|
18417
|
|
P×2Ad@2CD, I
|
–2597.76634
|
–2597.63136
|
28016
26875
|
17784
17018
|
|
P×2Ad@2CD, II
|
–2597.78203
(–9.8) |
–2597.64670
(–9.6) |
27890
|
17738
|
| a experiment; b DE, energy difference between structures I and II, kcal/mol. |
2.1.4. Lifetimes and decay kinetics of RTP of the three-component systems. The RTP decay curve of Pd10@2CD shows (Fig. 5a) that the RTP decay is the sum of two exponentials with long-lived (2.4 s) and short-lived (0.17 s) lifetimes. It can be assumed that the presence of the biexponential decay indicates that RTP is generated by the Pd10 molecules in two PSs of different structures, introduced as microimpurities into the CD crystal lattice and characterized by different rate constants of nonradiative deactivation knr of Pd10 phosphorescence (vide infra).
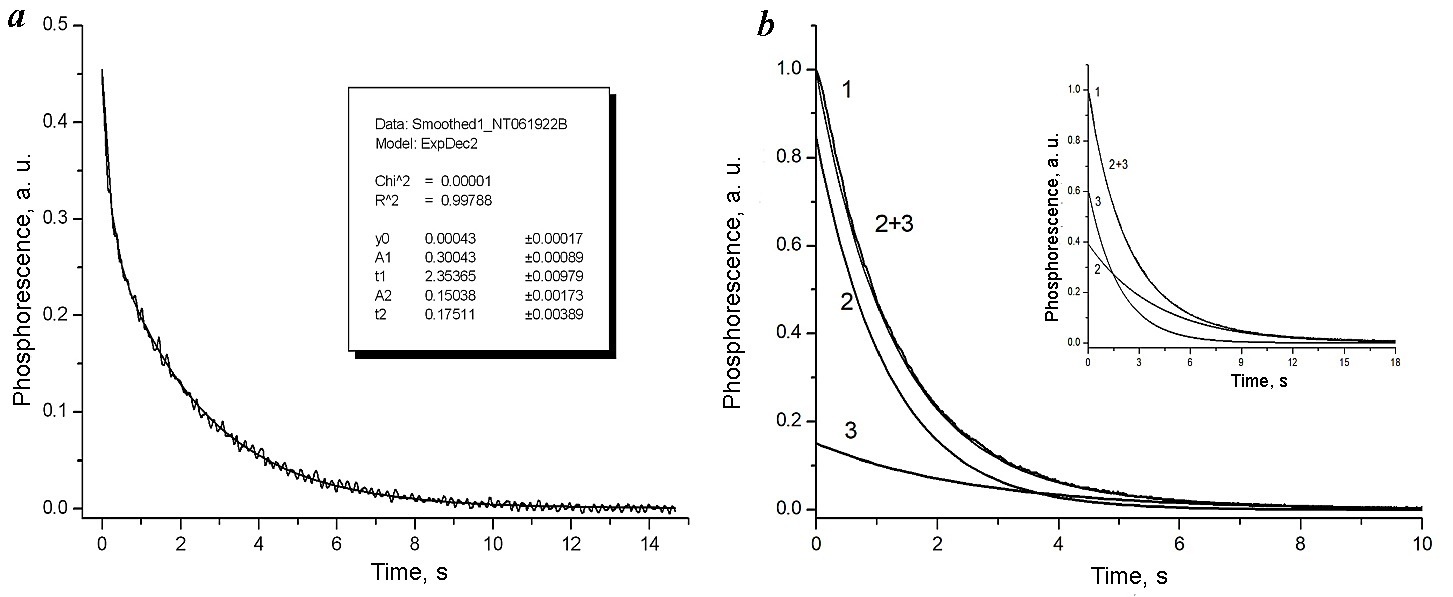
Figure 5. Experimental RTP decay curve in the absence of oxygen for Pd10@2CD complex (a). An inset presents the results of decomposing the curve into a sum of two exponents with times of 2.4 and 0.17 s (R-factor = 0.997). Experimental RTP decay curve in the presence of oxygen for Pd10–CD–tBT complex 1 and its presentation as a sum of calculated exponents 2 and 3 (b). An inset presents the RTP decay curves for Pd10–CD–tBt in the absence of oxygen.
The RTP decay for Pd10–CD–tBT and Pd10–CD–tBB is also biexponential. Figure 5b shows as examples the decay curves only for Pd10–CD–tBT, since for Pd10–CD–tBB the analogous curves were obtained. In all cases, the RTP decay curve in these complexes represented the sum of two exponentials I = I1 exp(–t/τ1) + I2 exp(–t/τ2) (Fig. 5b), which indicates the presence of two different PS structures. At the same time, for Pd10–CD–Ad, the RTP decay turned out to be monoexponential (R-factor = 0.997) with a lifetime of 2 s. Table 3 presents the results of calculating the kinetic characteristics of RTP for all the Pd10 complexes explored based on the formula given above and the formulas for calculating the constants in Section 2.3 (vide infra).
From Table 3 it follows that knr for the Pd10@CD complex is higher than the corresponding values for the Pd10–CD–BM complexes. This is not surprising, since knr characterizes the degree of quenching effect of the Pd10 microenvironment on its RTP in PS, preferably having structure I (vide infra), where the luminophore is surrounded only by highly mobile water molecules.
Table 3. Lifetimes τ1 and τ2 and normalized amplitudes (I1) and (I2) of the RTP decay curves for Pd10 in Pd10–CD–BM complexes in the presence (+O2) and absence (–O2) of oxygen; kq and knr are rate constants of quenching with oxygen and non-radiative process for the short-lived (a) and long-lived (b) components of RTP of Pd10
|
System
|
τ1, s (I1) +О2
|
τ2, s (I2) +О2
|
τ1, s (I1) –О2
|
τ2, s (I2) –О2
|
kq×[O2], s–1
|
knr, s–1
|
||
|
a
|
b
|
a
|
b
|
|||||
|
Pd10@2CD
|
–
|
–
|
0.175
|
2.35
|
–
|
–
|
5.72
|
0.262
|
|
Pd10–CD–tBB
|
0.39 (0.77)
|
1.88 (0.23)
|
1.41 (0.35)
|
2.56 (0.65)
|
1.64
|
0.12
|
0.55
|
0.227
|
|
Pd10–CD–tBT
|
1.09 (0.75)
|
2.27 (0.25)
|
1.81 (0.6)
|
4.02 (0.4)
|
0.33
|
0.17
|
0.39
|
0.086
|
|
Pd10–CD–Ad
|
|
2.2
|
|
2.9
|
|
0.1
|
|
0.182
|
The maximum values of RTP τph equal to 1.81 and 4.02 s for the Pd10–CD–tBT system in the absence of oxygen correspond to the minimum values of the quenching constants knr compared to knr in the complexes with tBB and Ad. This indicates that the use of tBT as a BM forms such a microenvironment of Pd10 in the complex that most effectively isolates the luminophore from RTP quenching due to nonradiative processes. At the same time, the Pd10–CD–Ad system in the studied series of BMs is characterized by the minimum value of kq[O2]. This indicates that the Pd10 microenvironment in it prevents phosphorescence quenching by oxygen more effectively than in other systems.
2.2. Proposed structures of the phosphorescent sites
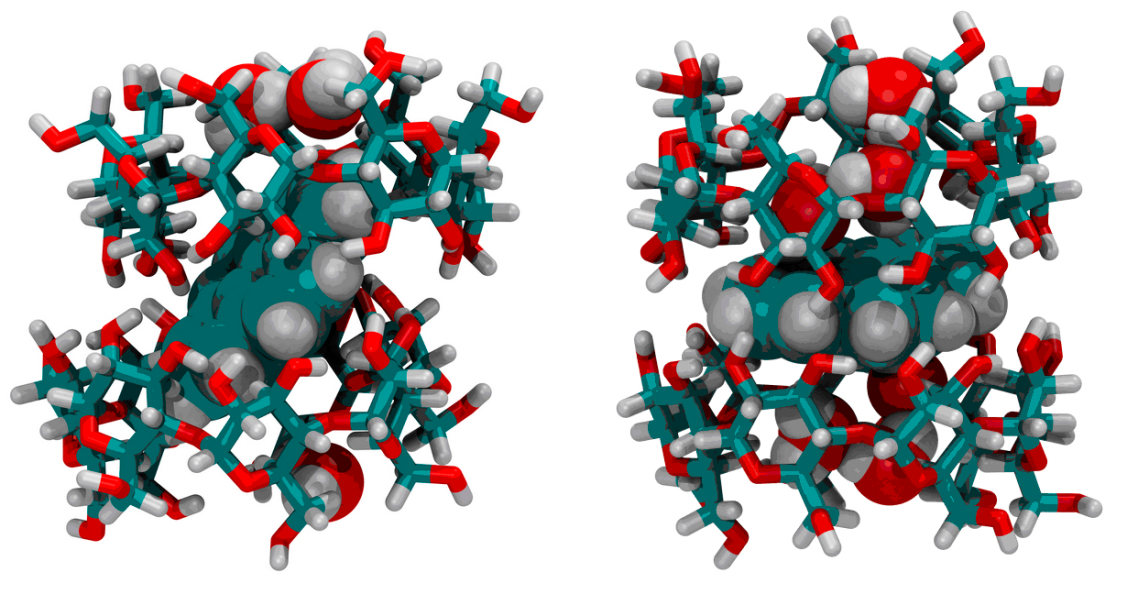
2.2.1. Two-component system Pd10@2CD. Since pyrene in the presence of CD forms an inclusion complex P@2CD in an aqueous solution [12], the long-lived RTP with a lifetime of τph = 2.4 s observed by us belongs to the Pd10 molecule in the Pd10@2CD complex included in the CD crystal hydrate. The assumption about the presence of two types of PS for two-component Pd10@2CD complexes is consistent with the result of previously performed molecular dynamics calculations [13b, 24], according to which inclined I and transverse II orientations of P relative to the vertical axis of the CD dimer, from which the crystal is built, are possible (Fig. 6).
 |
|
| I | II |
Figure 6. P×(H2O)8@2CD (I) and P×(H2O)12@2CD (II) images of instant structures from molecular dynamic trajectories (here, carbon atoms are marked in blue, oxygen atoms are marked in red, and hydrogen atoms are marked in grey) [13b].
Configuration I is more stable than configuration II and exists for 72% of the total simulation time. The more favorable configuration I contains four water molecules in each of the cavities. In structure II, six water molecules are placed in each of the cavities, since the free volume of the cavity in II is larger than that in I. Water molecules filling the free volume in the cavity actually act as BM, but at the same time they are carriers of oxygen, the main quencher of phosphorescence. Therefore, to observe RTP of the Pd10@2CD complex, it was necessary to remove O2. It can be assumed that in the crystalline precipitate of Pd10@2CD, structures I and II play the role of PS, which correspond to two exponents in the RTP attenuation of Pd10. The reality of structure II is confirmed by the presence of two crystal structures with the codes ABUTEY, PUKPIU and PUKPOA in the Cambridge Crystallographic Data Bank CCDC [25].
2.2. Structures, formation energies, and spectral characteristics of the phosphorescent sites. The concentration ratio of the reagents (CD and BM ~10–2, Pd10 ~10–6 M) used for the preparation of the samples shows that Pd10 is actually a microimpurity in the 2BM@2CD crystal. This resembles the previously studied phenanthrene–tBB–CD system [24a], which, as was shown by the MD calculations [24b], is included in a crystal whose lattice consists of 2tBB@2CD dimers packed into columns (Fig. 7).
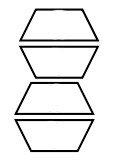
Figure 7. Arrangement of 2CD in the crystalline lattice.
Phenanthrene molecules are embedded inside some of them. Such three-component complexes play the role of PSs. The calculations showed that the crystal lattice built from CD dimers retains stability, weakly depending on the structure of the embedded BM, provided that its molecule fits into the cavity of the dimer. Therefore, we assumed that our system is constructed in a similar way, and PSs represent three-component complexes Pd10·2BM@2CD, embedded in the crystal lattice of 2BM@2CD dimers. The most probable structures of the three-component complexes were calculated using quantum chemistry methods.
Comparing the structures of tBB and tBT with structures I and II in Fig. 6, it can be seen that in structure II, according to the MFCV principle, the P plane should contact with the tert-butyl group of tBB or tBT, whereas for structure I, in the case of tBB, P should contact with the benzene ring, and in the case of tBT, the contact should be realized with the methylphenyl group (Fig. 8).
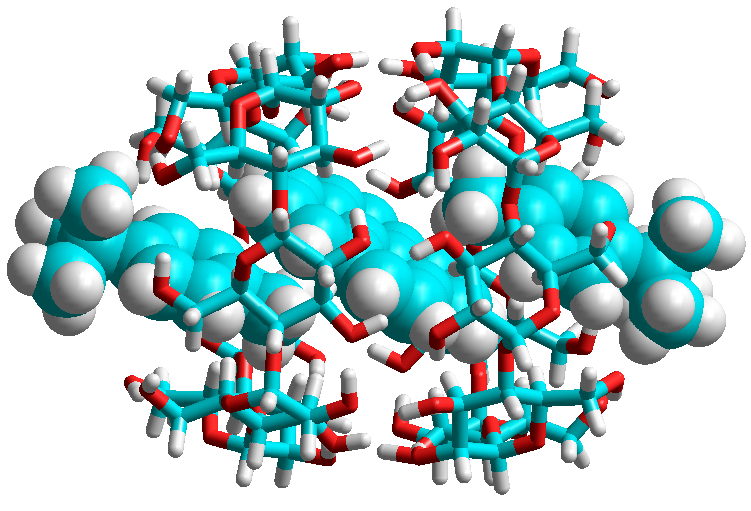
Figure 8. Structure of the P·2tBT@CD complex calculated by the DFT/B3LYP/D3 method.
The criterion for assessing the correctness of the choice among the calculated structures of the complexes that could be selected as the PS model, calculated by quantum chemistry methods, were the values of relative energies of the P·2BM@2CD complexes of types I and II, as well as the values of ν0–0 in the fluorescence and phosphorescence spectra (within the TDDFT method, the vibrational structure of the spectra is not calculated). These criteria are fully satisfied by the structure presented in Fig. 8. The results of the calculations of the energy and spectral characteristics of the complexes are given in Table 2.
The calculated data suggests that among all the P·2BM@2CD complexes, structure I is advantageous only for P·2tBT@2CD, since it is characterized by a more negative value of Etotal compared to that of structure II and, the value of ΔE is positive in both S0 and S1 states. The calculated values of ν0–0 for P·2tBT@2CD I are closest to the experimental values of 26840 and 17013 cm–1 (Table 2).
For the Pd10–CD–tBB system, only the calculated value of ν0–0 is comparable with the experimental value of 17013 cm–1, whereas for Pd10–CD–Ad, the agreement between the calculation and experiment is worse than for the other systems.
Figure 8 shows that the structure of P·2tBT@2CD is characterized by the minimum free volume (i.e., it best corresponds to the MFCV principle). The geometric and spectral advantage of the P·2tBT@2CD structure is consistent with the fact that the use of tBT as a BM leads to the longest RTP and, consequently, to the minimum nonradiative constant knr, 0.086 s–1, which indicates the densest microenvironment of Pd10 in PS. For the complexes with tBB and Ad, on the contrary, structure II is energetically more favorable. At the same time, the agreement between the calculated and experimental frequencies of ν0–0 for P·2tBB@2CD and P·2Ad@2CD is significantly worse than that for P·2tBT@2CD.
2.2.3. RTP lifetimes of arenes in the complexes with β-cyclodextrin. Table 4 compares the lifetimes of the arene RTP in the complexes with β-cyclodextrin with added identical BMs.
Table 4. RTP lifetimes of three-component A–CD–BM complexes in the presence and absence of O2
|
A
|
BM
|
τph +O2
|
τph –O2
|
|
Naphthalene-d8
|
tBB
tBT
Ad
|
14 [19]
4.8 [19]
10 [11a]
|
16.4 [19]
6.6 [19]
15 [11a]
|
|
Phenanthrene
|
tBB
Ad
|
2.4 [19, 20]
2.2 [11b]
|
2.7 [19, 20]
4.1 [11b]
|
|
Pyrene-d10a
|
tBB
tBT
Ad
|
1.88
2.27
2.2
|
2.56
4.02
2.9
|
| a for the data on pyrene-d10, see Table 2. |
It is obvious that among simple arenes, the naphthalene-d8 complexes give the longest phosphorescence. However, each arene phosphoresces in its own spectral range. The advantages of pyrene are as follows. Since it is widely used in analytical practice, the discovery of new properties can expand its application scope. First of all, this relates to the long-lived RTP, which has not been studied before. We demonstrated that it can be observed relatively easily even without removing oxygen and with the naked eye as a bright orange emission.
3. Experiment and calculations
3.1. Experimental section
3.1.1. Sample preparation. Double-distilled water, Pd10 (Aldrich), CD (Acros Organics), reagent grade tBB, tBT, and Ad were purchased from commercial sources and used in the complex preparation without purification. Pd10@CD complex was prepared by adding 2 mL of an aqueous solution of CD with a concentration of 10–2 M to a quartz cuvette, on the walls of which, after evaporation from a hexane solution, Pd10 was present in the form of a thin layer in such an amount that its concentration in the solution was several μM. After heating the cuvette in a thermostat at 50 °C with simultaneous ultrasonic irradiation for 1 h, an aqueous solution of Pd10@CD complex was formed.
When an aqueous solution of CD with a concentration of 6·10–2 M was added to a cuvette with Pd10, a microcrystalline precipitate formed on the walls of the resulting complex solution, in which Pd10 exhibited long-lived RTP after the addition of sodium sulfite used to remove oxygen.
To obtain the three-component complexes, several μL of tBB or tBT were added to a cuvette with an aqueous solution of Pd10@CD. The complexes with Ad were obtained in a similar manner by adding an aqueous solution of CD to a cuvette where Ad was applied to the walls in addition to Pd10. The cuvettes were then subjected to heating in a thermostat as described above. The resulting samples represented aqueous suspensions of microcrystals of the three-component complexes, the sedimentation time of which always exceeded the measured RTP lifetimes by orders of magnitude. The concentrations of CD, tBB, tBT, and Ad in the samples were 10–2 M. Therefore, it could be expected that with such a ratio of the reagents, all Pd10 would be bound into Pd10–CD–BM complexes. The measurements were performed both in the presence of oxygen and in its absence after the addition of Na2SO3.
3.1.2. Measurements. The lifetime of Pd10 RTP in the complexes was measured using a modernized experimental unit [18]. The maximum value of τph for Pd10 in Pd10–CD–tBT complex at 77 K (τ77), which we measured for the first time, composed 6.13 s and was used to calculate the rate constants of nonradiative deactivation knr of a triplet state of Pd10. The steady-state fluorescence and phosphorescence spectra of Pd10 in the complexes were measured on a modernized Elumin-2M spectrofluorometer with excitation by a UVTOP335 LED (Sensor Electronic Technology) with an emission maximum at 335 nm. All the main measurements were performed at 21 °C. The fluorescence and phosphorescence spectra of the Pd10 complexes were measured at a spectral slit width of the monochromator of 1 and 2 cm–1, respectively.
3.2. Calculations
3.2.1. Calculation of the constants of nonradiative deactivation and quenching of RTP. The lifetime of phosphorescence of A is determined by the formula
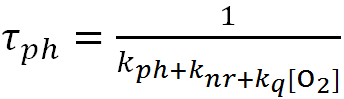 |
, |
where kph, knr, and kq are the rate constants of the radiative transition, nonradiative processes, and oxygen quenching, respectively. The formulas for calculating the constants kq and knr were publihsed elswhere [19]:
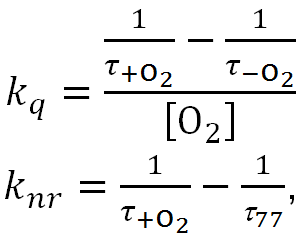
where τ+O2 and τ–O2 are the phosphorescence lifetimes in the presence and absence of oxygen, respectively, and [O2] = 2.65·10–4 M is the oxygen concentration in the aqueous suspension of the complex at room temperature [26].
3.2.2. Quantum chemical calculations. To determine the preferred arrangement of PS in the CD dimer, the equilibrium geometry of isolated P·2BM@2CD complexes in the ground S0 and excited S1 states was calculated using the ORCA-5.0.3 software package [27] by the RI/DFT/B3LYP/D3BJ and RI/TDDFT-TDA/B3LYP/D3BJ methods (where D3BJ is the procedure allowing for consideration of the dispersion correction), respectively, in the three-exponential def2-TZVP basis. The number of calculated excited states was 5 for each state. The calculations were carried out using the ONIOM procedure, in which 2CD dimer was calculated using the semiempirical PM3 method (QM1), while the embedded complex P·2BM was calculated using the DFT/D3BJ and TDDFT/D3BJ (QM2) methods in the same def2-TZVP basis. Simultaneously, the frequency of 0–0 transitions of the vibronic fluorescence and phosphorescence spectra (ν0–0) was calculated. The vibration frequencies and displacement vectors of the atoms in the Pd10 molecule were calculated using the DFT method with the PBE functional in the three-exponential 3ζ basis using Priroda-04 program [28].
Conclusions
The long-lived room-temperature phosphorescence of Pd10 was detected for the first time in the crystalline precipitate of Pd10@2CD complex after oxygen removal (τph =2.4 s), as well as in the crystalline precipitates formed after the addition of BM (tBB, tBT, and Ad) to a solution of Pd10@2CD. In these crystalline precipitates, Pd10 plays the role of a phosphorescent probe. Due to the densest packing of PS, provided by the addition of tBT, Pd10–CD–tBT system demonstrates maximum τph of 1.8 and 4.02 s in the presence and absence of oxygen, respectively. The biexponential character of the RTP decay observed for Pd10–CD–tBT and Pd10–CD–tBB is likely to be associated with two types of PS packing in the CD dimer, calculated earlier by the molecular dynamics method.
The rate constants of RTP emission and quenching, determined based on the experimental data, containing information on the packing density of Pd10 in PS, correlate with the PS structure, which was calculated by quantum chemistry methods. According to the results obtained, the PSs are nanosized three-component complexes Pd10·2BM@2CD, incorporated as microimpurities into the crystal lattice of 2BM@2CD dimers.
An important feature of the supramolecular systems explored is that the excited molecule of Pd10 has two levels of protection from oxygen. It is isolated from the environment, being firmly clamped between two BM molecules in the three-component complex P·2BM@2CD. The latter is additionally stabilized by inclusion in the crystal lattice built from binary complexes 2BM@2CD. Earlier the mechanism of RTP quenching in A·2BM@2CD systems under the action of oxygen was discussed using the example of naphthalene and phenanthrene complexes with CD [19, 20].
The phosphorescence and fluorescence spectra of Pd10–CD–BM at room temperature and 77 K revealed a fine vibronic structure, which belongs to two progressions of transitions to the ground and first overtone vibrational level of the S0 state. The assignment carried out based on the calculations of the vibrational spectra of Pd10 shows that even symmetry Ag vibrational transitions ν13, ν11, ν9, ν6 and ν25, ν23 (B3g), ν9, ν6 (Ag) in the fluorescence and phosphorescence spectra of Pd10, respectively, are active in radiative transitions from the excited levels S1 and T1.
Acknowledgements
This work was performed with financial support from the Ministry of Science and Higher Education of the Russian Federation within the framework of the State Assignments of the NRC "Kurchatov Institute" in the part of "Quantum-chemical calculations" and the Federal Research Center for Chemical Physics and Medicinal Chemistry of the Russian Academy of Sciences in the part of "Photonics of molecular and nanoscale systems" (124013000686-3).
References
- Y. Wang, H. Gao, J. Yang, M. Fang, D. Ding, B. Z. Tang, Z. Li, Adv. Mater., 2021, 33, e2007811. DOI: 10.1002/adma.202007811
- F.-F. Shen, Y. Chen, X. Dai, H.-Y. Zhang, B. Zhang, Y. Liu, Y. Liu, Chem. Sci., 2021, 12, 1851–1857. DOI: 10.1039/D0SC05343K
- Kenry, C. Chen, B. Liu, Nat. Commun., 2019, 10, 2111. DOI: 10.1038/s41467-019-10033-2
- Z. Zhang, Y.-e. Shi, Y. Liu, Y. Xing, D. Yi, Z. Wang, D. Yan, Chem. Eng. J., 2022, 442, 136179. DOI: 10.1016/j.cej.2022.136179
- D. Li, Y. Yang, J. Yang, M. Fang, B. Z. Tang, Z. Li, Nat. Commun., 2022, 13, 347. DOI: 10.1038/s41467-022-28011-6
- Y. Zhang, Y. Su, H. Wu, Z. Wang, C. Wang, Y. Zheng, X. Zheng, L. Gao, Q. Zhou, Y. Yang, J. Am. Chem. Soc., 2021, 143, 13675–13685. DOI: 10.1021/jacs.1c05213
- X. Yao, H. Ma, X. Wang, H. Wang, Q. Wang, X. Zou, Z. Song, W. Jia, Y. Li, Y. Mao, M. Singh, W. Ye, J. Liang, Y. Zhang, Z. Liu, Y. He, J. Li, Z. Zhou, Z. Zhao, Y. Zhang, G. Niu, C. Yin, S. Zhang, H. Shi, W. Huang, Z. An, Nat. Commun., 2022, 13, 4890. DOI: 10.1038/s41467-022-32029-1
- Z. Chai, C. Wang, J. Wang, F. Liu, Y. Xie, Y.-Z. Zhang, J.-R. Li, Q. Li, Z. Li, Chem. Sci., 2017, 8, 8336–8344. DOI: 10.1039/C7SC04098A
- W. Zhou, G. Wen, K. Li, H. Xiong, J. Zhang, S. Lu, X. Chen, Dyes Pigm., 2022, 205, 110481. DOI: 10.1016/j.dyepig.2022.110481
- V. B. Nazarov, V. I. Gerko, M. V. Alfimov, Russ. Chem. Bull., 1996, 45, 2109–2112. DOI: 10.1007/BF01430720
- (a) V. B. Nazarov, V. G. Avakyan, M. V. Alfimov, T. G. Vershinnikova, Russ. Chem. Bull., 2003, 52, 916–922. DOI: 10.1023/A:1024404526893; (b) V. B. Nazarov, V. G. Avakyan, E. I. Bagrii, T. G. Vershinnikova, M. V. Alfimov, Russ. Chem. Bull., 2005, 54, 2752–2756. DOI: 10.1007/s11172-006-0188-0
- (a) T. Yorozu, M. Hoshino, M. Imamura, H. Shizuka, J. Phys. Chem., 1982, 86, 4422–4426. DOI: 10.1021/j100219a030; (b) A. Munoz de la Pena, T. Ndou, J. B. Zung, I. M. Warner, J. Phys. Chem., 1991, 95, 3330–3334. DOI: 10.1021/j100161a067
- (a) V. G. Avakyan, V. B. Nazarov, A. V. Koshkin, M. V. Alfimov, High Energy Chem., 2015, 49, 177–182. DOI: 10.1134/S0018143915030030; (b) V. G. Avakyan, V. B. Nazarov, A. V. Odinokov, A. V. Koshkin, M. V. Alfimov, J. Lumin., 2016, 180, 328–340. DOI: 10.1016/j.jlumin.2016.08.051
- C. J. Easley, M. Mettry, E. M. Moses, R. J. Hooley, C. J. Bardeen, J. Phys. Chem. A, 2018, 122, 6578–6584. DOI: 10.1021/acs.jpca.8b05813
- L. Li, Z. Zhang, W. Long, A. Tong, Spectrochim. Acta, Part A, 2001, 57, 385–393. DOI: 10.1016/S1386-1425(00)00396-6
- A. M. Raj, G. Sharma, R. Prabhakar, V. Ramamurthy, J. Phys. Chem. A, 2019, 123, 9123–9131. DOI: 10.1021/acs.jpca.9b08354
- (a) A. S. Castillo, A. S. Carretero, J. M. Costa Fernández, W. J. Jin, A. F. Gutiérrez, Anal. Chim. Acta, 2004, 516, 213–220. DOI: 10.1016/j.aca.2004.04.003; (b) T. V. Dinh, E. L. Yen, J. D. Winefordner, Anal. Chem., 1976, 48, 1186–1188. DOI: 10.1021/ac50002a030
- (a) V. B. Nazarov, V. I. Gerko, M. V. Alfimov, Russ. Chem. Bull., 1996, 45, 969–970. DOI: 10.1007/BF01431336; (b) V. B. Nazarov, V. I. Gerko, M. V. Alfimov, Russ. Chem. Bull., 1997, 46, 1386–1388. DOI: 10.1007/BF02505671
- V. B. Nazarov, V. G. Avakyan, M. V. Alfimov, High Energy Chem., 2021, 55, 193–195. DOI: 10.1134/S0018143921020090
- V. G. Avakyan, S. V. Titov, V. B. Nazarov, M. V. Alfimov, J. Lumin., 2022, 242, 118581. DOI: 10.1016/j.jlumin.2021.118581
- K. Kalyanasundaram, J. K. Thomas, J. Am. Chem. Soc., 1977, 99, 2039–2044. DOI: 10.1021/ja00449a004
- V. G. Avakyan, V. B. Nazarov, M. V. Alfimov, High Energy Chem., 2018, 52, 206–211. DOI: 10.1134/S0018143918030037
- H. Shinohara, Y. Yamakita, K. Ohno, J. Mol. Struct., 1998, 442, 221–234. DOI: 10.1016/S0022-2860(97)00335-9
- (a) S. V. Titov, V. G. Avakyan, V. B. Nazarov, Russ. Chem. Bull., 2018, 67, 2178–2183. DOI: 10.1007/s11172-018-2351-9; (b) S. V. Titov, V. G. Avakyan, CrystEngComm, 2022, 24, 6654–6661. DOI: 10.1039/D2CE00852A
- C. R. Groom, I. J. Bruno, M. P. Lightfoot, S. C. Ward, Acta Crystallogr., Sect. B: Struct. Sci., Cryst. Eng. Mater., 2016, 72, 171–179. DOI: 10.1107/S2052520616003954
- S. L. Murov, Handbook of Photochemistry, Marcel Dekker, New York, 1973.
- F. Neese, WIREs Comput. Mol. Sci., 2022, 12, e1606. DOI: 10.1002/wcms.1606
- D. N. Laikov, Yu. A. Ustynyuk, Russ. Chem. Bull., 2005, 54, 820–826. DOI: 10.1007/s11172-005-0329-x