


2021 Volume 4 Issue 1
|
|
INEOS OPEN, 2021, 4 (1), 35–40 Journal of Nesmeyanov Institute of Organoelement Compounds |
|


Kinetic Modeling of the Formation of Peptide Nanoparticles
by Tryptic Hydrolysis of Β-Casein
Nesmeyanov Institute of Organoelement Compounds, Russian Academy of Sciences, ul. Vavilova 28, Moscow, 119991 Russia
Corresponding author: M. M. Vorob'ev, e-mail: mmvor@ineos.ac.ru
Received 10 February 2021; accepted 23 March 2021
Abstract

Peptide nanoparticles obtained by the enzymatic hydrolysis of proteins are new biocompatible nontoxic systems for the transport of biologically active compounds. The formation of peptide nanoparticles from -casein during its controlled hydrolysis by trypsin was modeled by the methods of chemical kinetics. The product of the time of nanoparticle formation (tmax) by the enzyme concentration (E0) was analyzed in different kinetic models. The dependence of tmax∙E0 on the enzyme concentration was used to estimate the contribution of the enzymatic and non-enzymatic stages to the formation of nanoparticles.
Key words: peptide nanoparticles, chemical kinetics, differential equations, beta-casein, trypsin.
Introduction
Many biologically active compounds poorly dissolve in an aqueous medium. They are transported in tissues and cells in the form of complexes with single macromolecules or nanoscale associates, mainly of the protein nature [1]. The same principle is used to deliver water-insoluble drugs to patients. The encapsulation of drugs in micelles is one of the promising methods for the targeted transport of hydrophobic drugs [2, 3]. Biocompatible non-toxic protein micelles significantly increase the solubility of hydrophobic compounds, which are used to develop transport systems based on various proteins, including mixtures of casein proteins (aS1-, b- and k-casein) and individual b-casein [4]. Recent interest in β-casein micelles, which are soap-like micelles, has been driven by their great potential as delivery vehicles for water-insoluble drugs [1–4].
Earlier we have studied the kinetics of b-casein (b-CN) hydrolysis (proteolysis) by trypsin and the formation of nanoparticles consisting of the products of enzymatic hydrolysis [5, 6]. This process was first demonstrated by static light scattering using the dissymmetry method (Debye method) for continuous recording of the concentration of nanoparticles and their size in the range of 10–200 nm during proteolysis. For this purpose, the light scattering intensities I(45o) and I(135o) were measured directly in the reaction mixture for 2–3 hours with a time resolution of 1–2 min [6, 7]. This method was used to determine the time of particle formation (tmax). Since nanoparticles are first formed during proteolysis and, then, degraded under the action of the same enzyme, it is important to find the time interval when the maximum number of nanoparticles is formed. It was shown that the obtained peptide nanoparticles differ from the original casein micelles in size and interaction mode with low-weight hydrophobic compounds [8]. The atomic force microscopy (AFM) analysis of these nanoparticles, dried on the surface of mica, enabled evaluation of their sizes, density, and structural heterogeneity [9]. The obtained nanoparticles were found to be approximately two times denser than the initial casein micelles. Since β-casein particles are polydisperse and the mechanism of their formation and further hydrolysis may be size-dependent, it was also important to study their size distribution in detail [10].
The formation of particles is represented by a consecutive scheme consisting of three stages: protein  oligopeptide fragments
  aggregates (particles)
  low peptides. The first and third steps are enzymatic and the corresponding rate constants (kI and kIII) are proportional to the enzyme concentration (E0). At the same time, the rate constant for the aggregation process (kII) does not depend on E0 but depends on the physicochemical conditions and the substrate concentration. The detailed scheme for particle formation includes many more steps and components than the above-mentioned one. We examined several such detailed schemes using chemical kinetic methods and defined the time dependences of the particle concentration. Since the differential equations corresponding to these schemes were nonlinear, numerical integration was used to solve them.
The present study aimed to theoretically model the process of nanoparticle formation using various kinetic models, which made it possible to estimate the product of the time of nanoparticle formation by the enzyme concentration as a linear function of the enzyme concentration. For these models, we investigated the effect of the rate constant of the non-enzymatic stage II on the overall rate of particle formation.
Results and discussion
Formation of peptide nanoparticles
The peptide nanoparticles were obtained by the limited hydrolysis of peptide bonds in b-CN (disordered oligopeptide with 209 amino acid residues) with trypsin (EC 3.4.21.4) [6–9]. This serine protease provides hydrolysis of some peptide bonds Arg-X and Lys-X, whereas the amount of the hydrolyzed bonds (degree of hydrolysis) can be varied by changing the hydrolysis time. The peptide nanoparticles, which differ from the original casein micelles, were obtained during hydrolysis for 5–65 min, depending on the concentrations of the protein and proteolytic enzyme [6–9]. The present work discusses the kinetic aspects of the formation of such nanoparticles.
If all three rate constants (kI, kII, and kIII) of the consecutive scheme of particle formation are strictly proportional to the enzyme concentration, then a simple theoretical calculation shows that the time of particle formation tmax is inversely proportional to E0, i.e., the dependence of tmax on E0 is simple hyperbola. At first glance, such a simple dependence is confirmed by the experimental data from Ref. [6] (Fig. 1). In this case, the term tmax∙E0 should be independent of E0 but dependent on the concentration of the protein substrate and the physicochemical conditions of the experiment (T, pH, etc.).

Figure 1. Experimental dependence of tmax on the enzyme concentration [6].
However, a more detailed analysis shows that tmaxE0 is not constant and increases almost linearly with an increase in E0 in the range of 0.1–1 mgL–1, at which the experiments on the formation of nanoparticles were carried out [6] (Fig. 2). This linear dependence is the subject of our study.
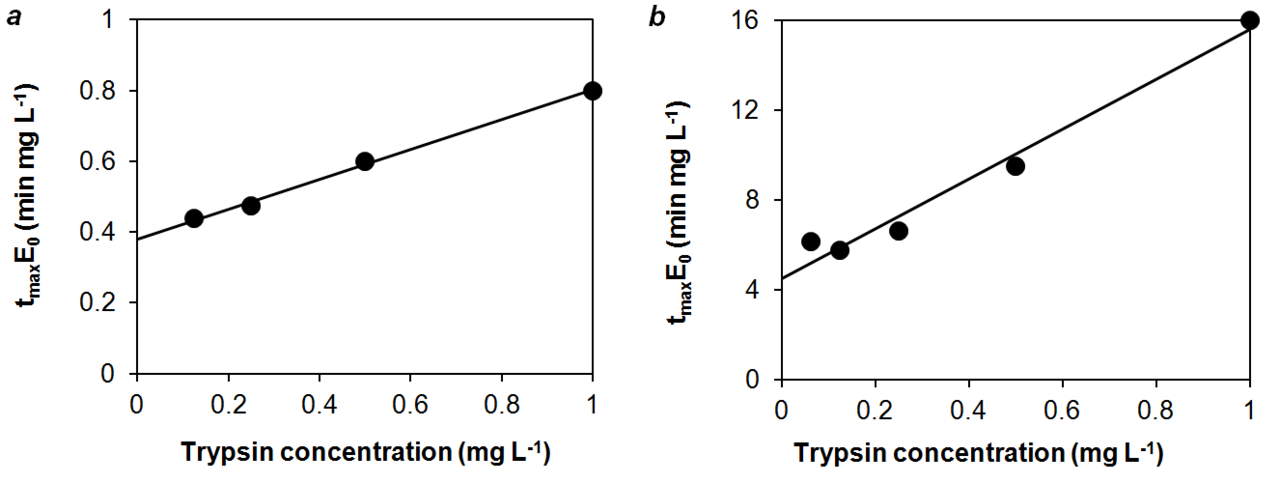
Figure 2. Experimental dependence of tmaxE0 on E0 at S = 0.25 gL–1 and different physicochemical conditions: T = 37 °C, phosphate buffer
(20 mM, pH = 7.9), without stirring (a); T = 37 °C, phosphate buffer (50 mM, pH = 7.9), with stirring (b). Data for tmax were taken from Ref. [6].
By approximating the experimental points in Fig. 2 with a linear relationship, we obtain the following values for the slope and intercept: tmaxE0 = 0.38 ± 0.01 + (0.42 ± 0.02)∙E0 (slope and intercept are presented as mean ± standard deviation, correlation coefficient r = 0.998) and tmaxE0 = 4.5 ± 0.5 + (11 ± 1)∙E0 (r = 0.987) in Figs. 2a and 2b, respectively. In the first case, the formation of particles occurred without stirring and the rate of aggregation was higher than in the second case. In this case, the slope of the straight line and intercept are greater in the second case, when the rate of aggregation is low due to stirring.
The simplest model in a quasi-stationary approximation
Let us consider the simplest scheme for the formation of particles, which affords an analytical solution in the quasi-stationary approximation:
|
|
(1) |
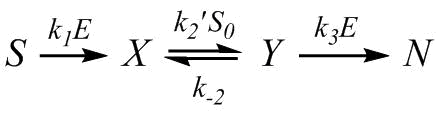
where S stands for the protein substrate, X stands for the hydrophobic fragment of the β-casein chain, Y stands for the particles, and N stands for the products of the hydrolysis of β-CN. The mass balance equation is: S + X + Y + N = S0, where S0 is the initial concentration of the protein substrate. The rate constants in Scheme (1) depend differently on the enzyme concentration E0 and substrate concentration S0: the rate constants for the first and third steps are proportional to E0, while the rate constant of the second step is k2 = k′2S0. In the quasi-stationary approximation (dY/dt = 0), the three-stage Scheme (1) can be reduced to a two-stage scheme:
 ,
,
where k″ = k3k2/(k-2+k3) = bE0/(1+cE0). The value of tmax for the two-stage scheme is tmax = ln(k1E0/k″)/(k1E0-k″) [11]. As a result, the following expression was obtained for tmaxE0:
|
|
(2) |

where k1 is the second-order rate constant that corresponds to the first step of Scheme (1), b = k3k2/k-2 is the parameter proportional to the rate constant of the non-enzymatic step k2, and c = k3/k-2. According to Eq. (2), the dependences of tmaxE0 on E0 were calculated for three different values of parameter b. According to Fig. 3, tmaxE0 increases with E0 and, similar to a linear relationship, the smaller the parameter b and, hence, k2, the greater the slope and intercept (Fig. 3).

Figure 3. Theoretical dependence of tmaxE0 on E0 according to Scheme (1) and Eq. (2) at k1 = 0.01, c = 100, and different values of b:
b = 1 (——), b = 5 (---), and b = 20 (– ∙ –).
Thus, for the simplest Scheme (1) it was shown that, at the rate constants of the enzymatic stages being equal, the slower the non-enzymatic process (step II), the greater the slope and intercept on the straight line.
Model 1
The complication of Scheme (1) was carried out taking into account the real nonlinear expression for the rate of enzymatic hydrolysis, given the saturation of trypsin and peptide bond demasking, as well as the loss of the substrate during its hydrolysis without the formation of nanoparticles. Model 1 is represented by the kinetic scheme shown below:
|
|
(3) |
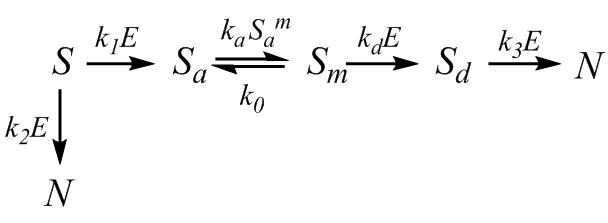
where S is the concentration of -casein (S0 is the initial concentration); N is the concentration of the final hydrolysis products; Sa is the concentration of the hydrophobic fragment of casein; Sm and Sd are the concentrations of the aggregates; E is the concentration of the free enzyme (E0 is the total concentration of the enzyme); m + 1 is the number of monomers in the aggregate. The free enzyme represents a part of the enzyme that is not inhibited or bound in the productive enzyme–substrate complex. Here, ka and k0 are the rate constants that describe the processes of association and dissociation; rate constants k1, k2, and k3 describe the hydrolysis of peptide bonds; and kd is the rate constant of demasking, which is quite specific for the degradation of protein aggregates and micelles by proteases [12].
The corresponding nonlinear differential equations were solved numerically in full without the quasi-stationary approximation. A decrease in the relative concentration of β-CN s = S/S0, an increase and, then, a decrease in the relative weight concentration of particles 2y = 2Sm/S0 as well as that of the relative concentration of the final products of hydrolysis (n = N/S0) are shown in Fig. 4. The time during which the maximum number of particles is formed was used to plot the dependence of tmaxE0 on E0.
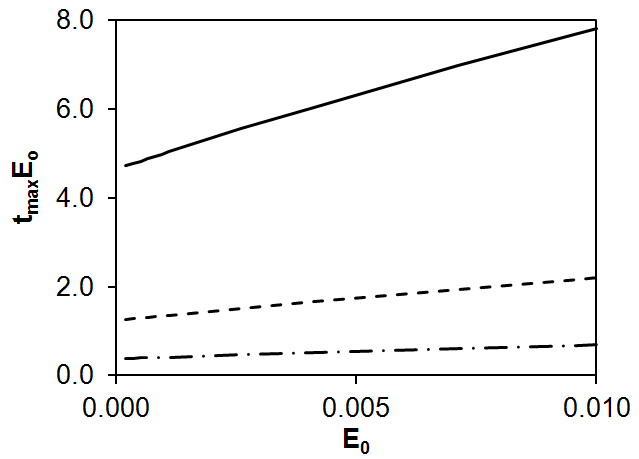
Figure 4. Changes in the relative component concentrations over time for Model 1: s (——); 2y (---); n (– ∙ –).
For Model 1, the dependence of tmaxE0 on E0 is presented in Fig. 5 for three parameters d which are proportional to the rate constant ka.
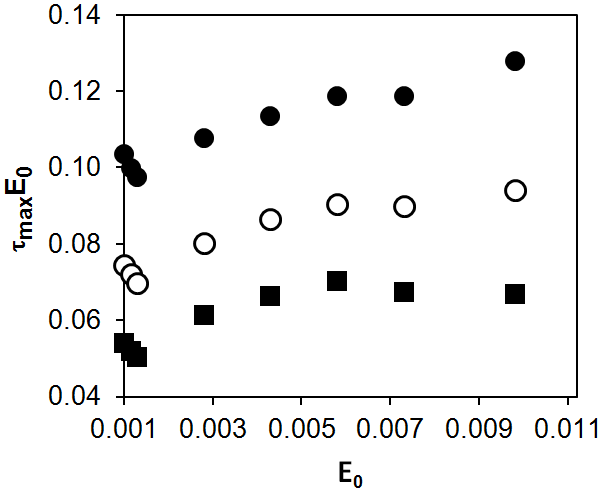
Figure 5. Numerical modeling of the dependence of tmaxE0 on E0 for Model 1: d = 0.01 (●), d = 0.1 (○), d = 1 (■).
The results of computer simulation for Model 1 showed that, in the range of 0.001–0.01 for E0, the product tmaxE0 increases with E0. Assuming that this dependence is linear, we determined its slope and intercept: tmaxE0 = 0.097 ± 0.003 + (3.28 ±0.44)∙E0 (r = 0.968) for d = 0.01; tmaxE0 = 0.072 ± 0.003 + (2.61 ± 0.58)∙E0 (r = 0.939) for d = 0.1; tmaxE0 = 0.055 ± 0.004 + (1.71 ± 0.78)∙E0 (r = 0.832) for d = 1. Thus, as in the case of the simplest scheme (Scheme (1)), the lower the rate constant of the non-enzymatic stage (ka), the greater the slope and intercept.
Model 2
The association behavior of β-CN and the size distribution of its micelles can be predicted in the framework of the Kegeles shell model [13, 14]. Therefore, in Model 2 we used the principles of this model to obtain the particle size distribution.
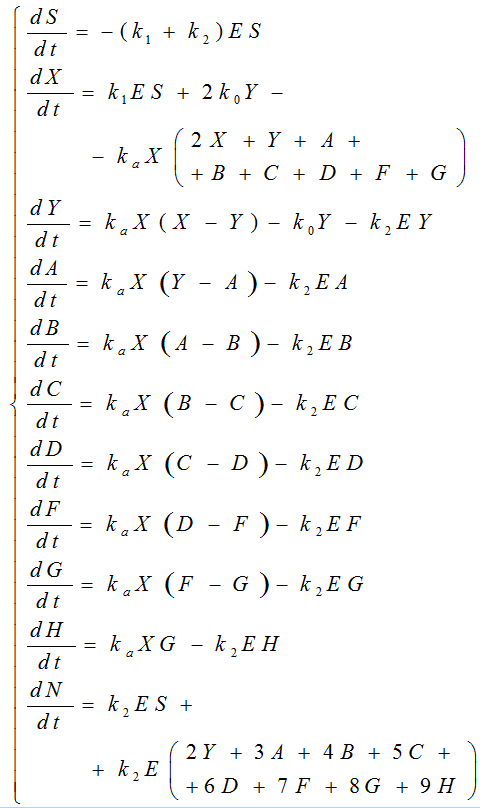
Model 2 is represented by the following kinetic scheme:
|
|
(4) |

where S is the concentration of β-CN (S0 is the initial concentration); N is the concentration of the final hydrolysis products; X is the hydrophobic fragment of β-casein; Y, A, B, C, D, F, G, and H are the concentrations of the aggregates (dimers, trimers, etc.); E is the concentration of the free enzyme; E0 is the total enzyme concentration. The rate constant ka describes the process of association, the rate constant k0 describes the dissociation of dimers, and the constants k1 and k2 describe the hydrolysis process.
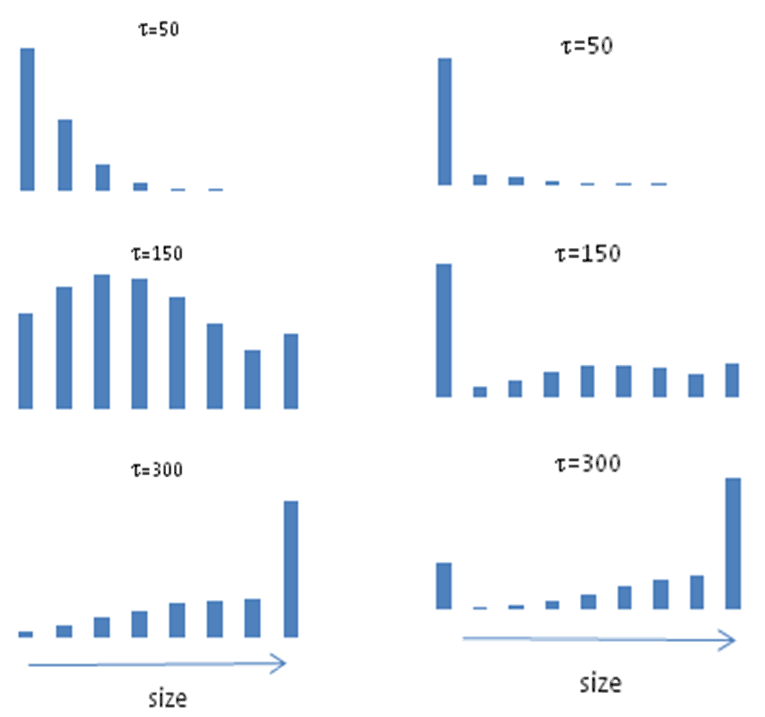
The simulation results are shown in Figs. 6 and 7 which demonstrate the evolution of the component distribution during hydrolysis. As expected, the distribution of particles shifted towards a larger particle size during hydrolysis with increasing time from 50 to 300.
 |
|
|
Figure 6. Distributions of the aggregates at various hydrolysis times t for Model 2. |
Figure 7. Molecular-weight distribution of the aggregates at various hydrolysis times t for Model 2. |
A decrease in the relative concentration of b-casein s = S/S0, an increase and, then, a decrease in the relative weight concentration of the largest aggregates (H component with 9 monomers) 9h = 9H/S0, as well as an increase in the relative concentration of the final hydrolysis products (n = N/S0) are shown in Fig. 8. The time, during which the maximum quantity of particles is formed, was used to plot the dependence of tmaxE0 on E0.

Figure 8. Changes in the relative concentrations of the components over time for Model 2: s (——); 9h (---); n (– ∙ –).
The results of computer simulation for Model 2 showed that, in the range of 0.001–0.01 for E0, the product tmaxE0 increases linearly with E0. As in Scheme (1) and Model 1, the lower the rate constant of the non-enzymatic stage (d or ka), the greater the slope and intercept of the dependence of tmaxE0 on E0.
Thus, all three theoretical approaches outlined here predict the same dependence behavior when changing the rate constant of the non-enzymatic stage. The same pattern was observed in the experiments, as is shown in Fig. 2 where the slope and intercept decrease with an increase in the association rate constant (step II).
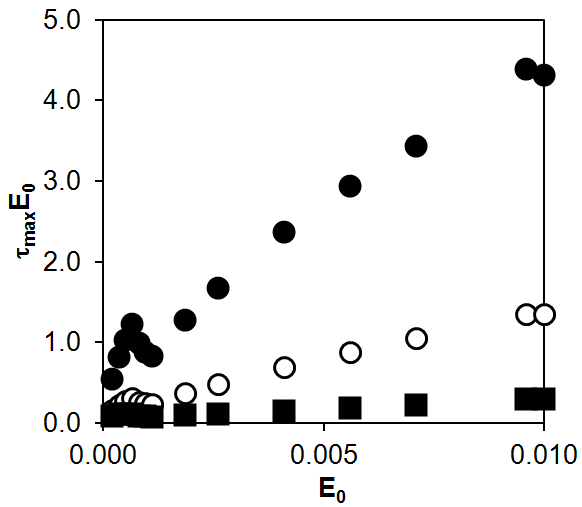
Figure 9. Numerical modeling of the dependence of tmaxE0 on E0 for Model 2: d = 0.01 (●), d = 0.1 (○), d = 1 (■).
Computer modeling
Model 1
For scheme (3), a system of five ordinary nonlinear differential equations is valid, reflecting the dynamics of the process in the framework of Model 1 at m = 1:
|
|
(5) |

The material balance equation is:
|
|
(6) |

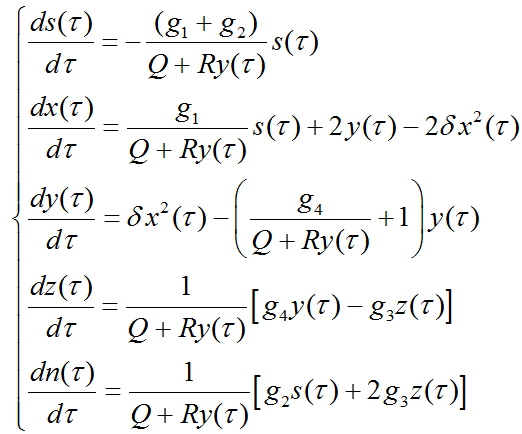
The system of differential equations in a dimensionless form that takes into account the saturation of the enzyme with the hydrolysis products is as follows:
|
|
(7) |
where  ,
,  ,
,  ,
,  , and
, and  are the dimensionless concentrations being variables; t = k0t is the dimensionless time;
  , and
, and  are the dimensionless parameters. The parameters km and are related to the saturation of the enzyme with the hydrolysis products.
The balance equation (7) can be rewritten as:
|
s0 = s + x + 2y + 2z + n |
(8) |
To solve the system of differential equations (4), it is necessary to set the initial conditions in the following form:
|
|
(9) |

Since the system of differential equations (7) is nonlinear, it was solved numerically. The solutions are the concentration functions over time for all variables.
Model 2
Scheme (4) is described by a system of eleven ordinary conjugate nonlinear differential equations that reflect the dynamics of the process:
|
|
(10) |
The material balance equation is:
|
|
(11) |

The system of differential equations in a dimensionless form that takes into account the saturation of the enzyme with the hydrolysis products is as follows:
|
|
(12) |

where  , and are the dimensionless concentrations being variables; t = k0t is the dimensionless time;
 , and
, and  are the dimensionless parameters. The parameters km and g are related to the saturation of the enzyme with the hydrolysis products.
The balance equation (11) can be rewritten as follows:
|
|
(13) |

To solve the system of differential equations (12), it is necessary to set the initial conditions in the form:
|
|
(14) |
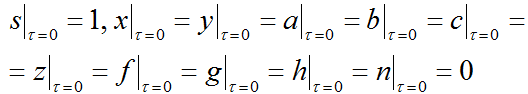
Since the system of differential equations (12) is nonlinear, it was solved numerically. The solutions are the concentration functions over time for all variables.
For numerical integration of the differential equation, we used the Wolfram Mathematica 10.0 mathematical software package and our program for the computer modeling of proteolysis based on the Runge–Kutta algorithm [15].
Conclusions
The complex processes of the formation of peptide nanoparticles with simultaneous hydrolysis of polypeptides and aggregation of peptide fragments were formally described by a limited number of differential equations. We used different kinetic models including the simple model, which gave the analytical solution, and two complex models, which required computer simulation. Their numerical solution afforded the description of the kinetics of particle formation. In all cases, the product of the time of nanoparticle formation tmax by the enzyme concentration E0 could be represented as a linear function of the enzyme concentration. This approach allowed us to analyze the temporal patterns of particle formation, in particular, to investigate the effect of the rate constant of aggregation on the overall rate of particle formation. We hope that the methods developed here will be useful for the quantitative study of other aspects of peptide nanoparticle formation by proteolysis.
Acknowledgements
This work was supported by the Russian Foundation for Basic Research, project no. 20-53-46006. Access to electronic scientific resources was provided by INEOS RAS with support from the Ministry of Science and Higher Education of the Russian Federation.
References
- L. Ya. Zakharova, R. R. Kashapov, T. N. Pashirova, A. B. Mirgorodskaya, O. G. Sinyashin, Mendeleev Commun., 2016, 26, 457–468. DOI: 10.1016/j.mencom.2016.11.001
- D.G. Dalgleish, Soft Matter, 2011, 7, 2265–2272. DOI: 10.1039/C0SM00806K
- E. Semo, E. Kesselman, D. Danino, Y. D. Livney, Food Hydrocolloids, 2007, 21, 936–942. DOI: 10.1016/j.foodhyd.2006.09.006
- Y. D. Livney, Curr. Opin. Colloid Interface Sci., 2010, 15, 73–83. DOI: 10.1016/j.cocis.2009.11.002
- M. M. Vorob'ev, M. Dalgalarrondo, J.-M. Chobert, T. Haertlé, Biopolymers, 2000, 54, 355–364. DOI: 10.1002/1097-0282(20001015)54:5<355::AID-BIP60>3.0.CO;2-H
- M. M. Vorob'ev, V. Vogel, W. Mäntele, Int. Dairy J., 2013, 30, 33–38. DOI: 10.1016/j.idairyj.2012.12.002
- М. М. Vorob'ev, K. Strauss, V. Vogel, W. Mäntele, Food Biophys., 2015, 10, 309–315. DOI: 10.1007/s11483-015-9391-6
- M. M. Vorob'ev, V. S. Khomenkova, O. V. Sinitsyna, О. А. Levinskaya, D. Kh. Kitaeva, A. V. Kalistratova, M. S. Oshchepkov, L. V. Kovalenko, K. A. Kochetkov, Russ. Chem. Bull., 2018, 67, 1508–1512. DOI: 10.1007/s11172-018-2248-7
- O. V. Sinitsyna, M. M. Vorob'ev, INEOS OPEN, 2019, 2, 50–54. DOI: 10.32931/io1909a
- M. M. Vorob'ev, O. V. Sinitsyna, Int. Dairy J., 2020, 104, 104652. DOI: 10.1016/j.idairyj.2020.104652
- E. T. Denisov, Kinetics of Homogeneous Chemical Reactions, Vysshaya Shkola, Moscow, 1988 [in Russian].
- M. M. Vorob'ev, J. Mol. Catal. B: Enzym., 2009, 58, 146–152. DOI: 10.1016/j.molcatb.2008.12.007
- G. Kegeles, J. Phys. Chem., 1979, 83, 1728–1732. DOI: 10.1021/j100476a009
- J. E. O'Connell, V. Ya. Grinberg, C. G. de Kruif, J. Colloid Interface Sci., 2003, 258, 33–39. DOI: 10.1016/S0021-9797(02)00066-8
- M. M.Vorob'ev, I. A. Goncharova, Nahrung, 1998, 42, 61–67. DOI: 10.1002/(SICI)1521-3803(199804)42:02<61::AID-FOOD61>3.0.CO;2-4